About
Overview
Procurement Team
FAQs
Extra
More R Resources Databases
Categories
All
(417)
API
(4)
Joscelin's fav
(40)
SQL
(1)
art
(6)
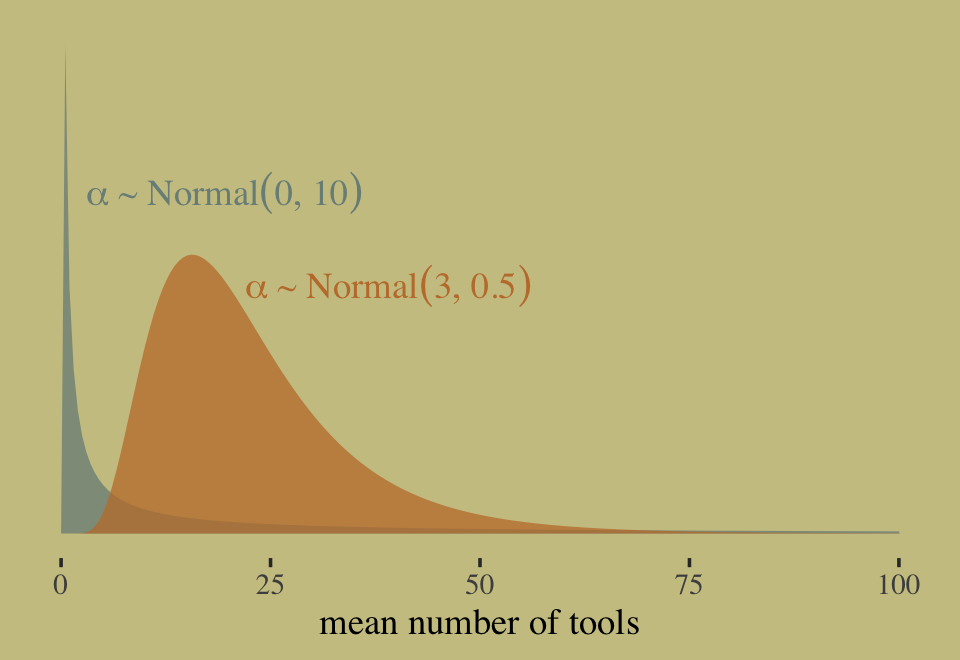
bayesian
(8)
blog
(10)
book
(57)
citation
(2)
course
(17)
cv
(2)
dashboards
(4)
data science
(24)
databases
(1)
datasets
(33)
dates
(1)
docker
(2)
documentation
(1)
eeg
(2)
email
(1)
eye tracking
(1)
factors
(1)
filenames
(1)
gam
(2)
geospatial
(6)
git
(7)
github
(6)
hockey
(1)
html
(1)
intro
(46)
jamovi
(1)
jupyter
(2)
learning R
(63)
learning r
(1)
llm
(3)
machine learning
(5)
markdown
(13)
meta-analysis
(5)
missing data
(3)
modeling
(6)
mri
(7)
neuro
(17)
nirs
(1)
not r related
(9)
organization
(2)
package
(38)
package creation
(3)
plugin
(1)
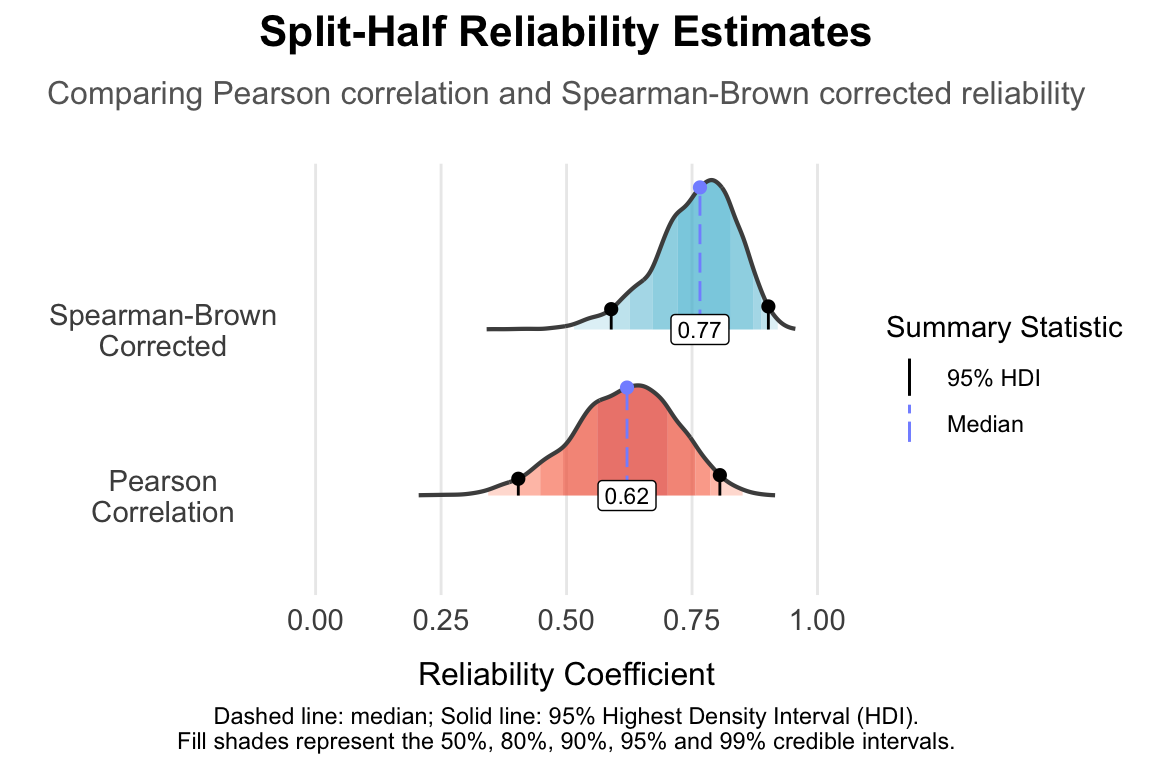
psychometrics
(1)
python
(15)
quarto
(9)
sas
(1)
scraping
(1)
sem
(1)
shiny
(4)
slack
(1)
slides
(10)
software dev
(1)
spark
(1)
stan
(1)
statistics
(97)
style
(2)
talk
(6)
teaching r
(9)
text message
(1)
tidyverse
(21)
tricks
(3)
tutorial
(4)
video
(19)
visualization
(135)
websites
(8)
workflows
(4)
wrangling
(21)
Resources
Order By
Default
Title
Date - Oldest
Date - Newest
Teaching Methods with R
statistics
Aug 13, 2025
Teacup Giraffes_Intro to Statistics🦒
statistics
Joscelin’s fav
Aug 13, 2025
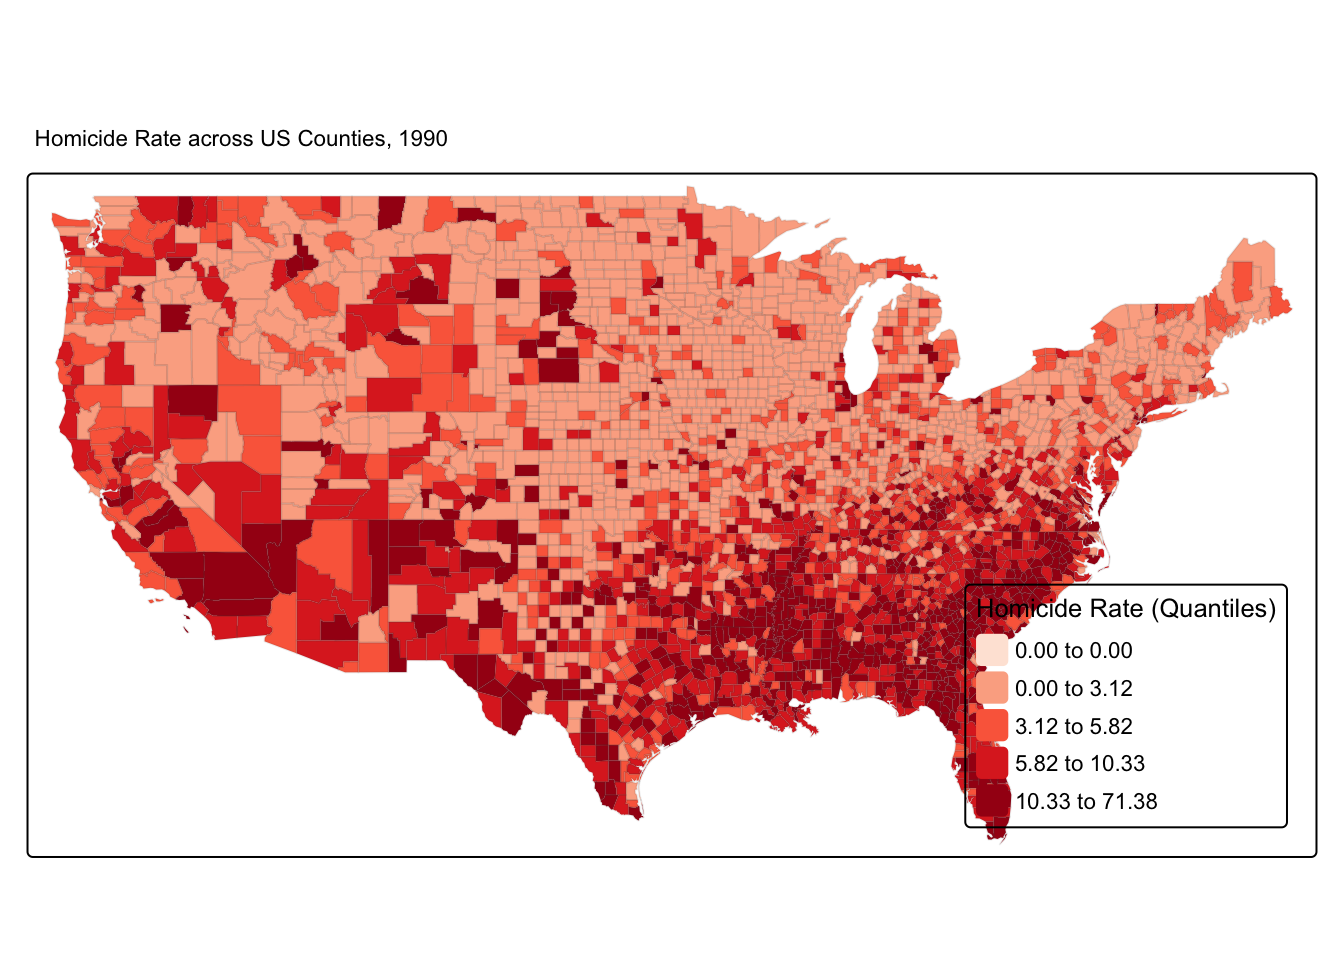
Test your model!! Performance package
statistics
Joscelin’s fav
Aug 13, 2025
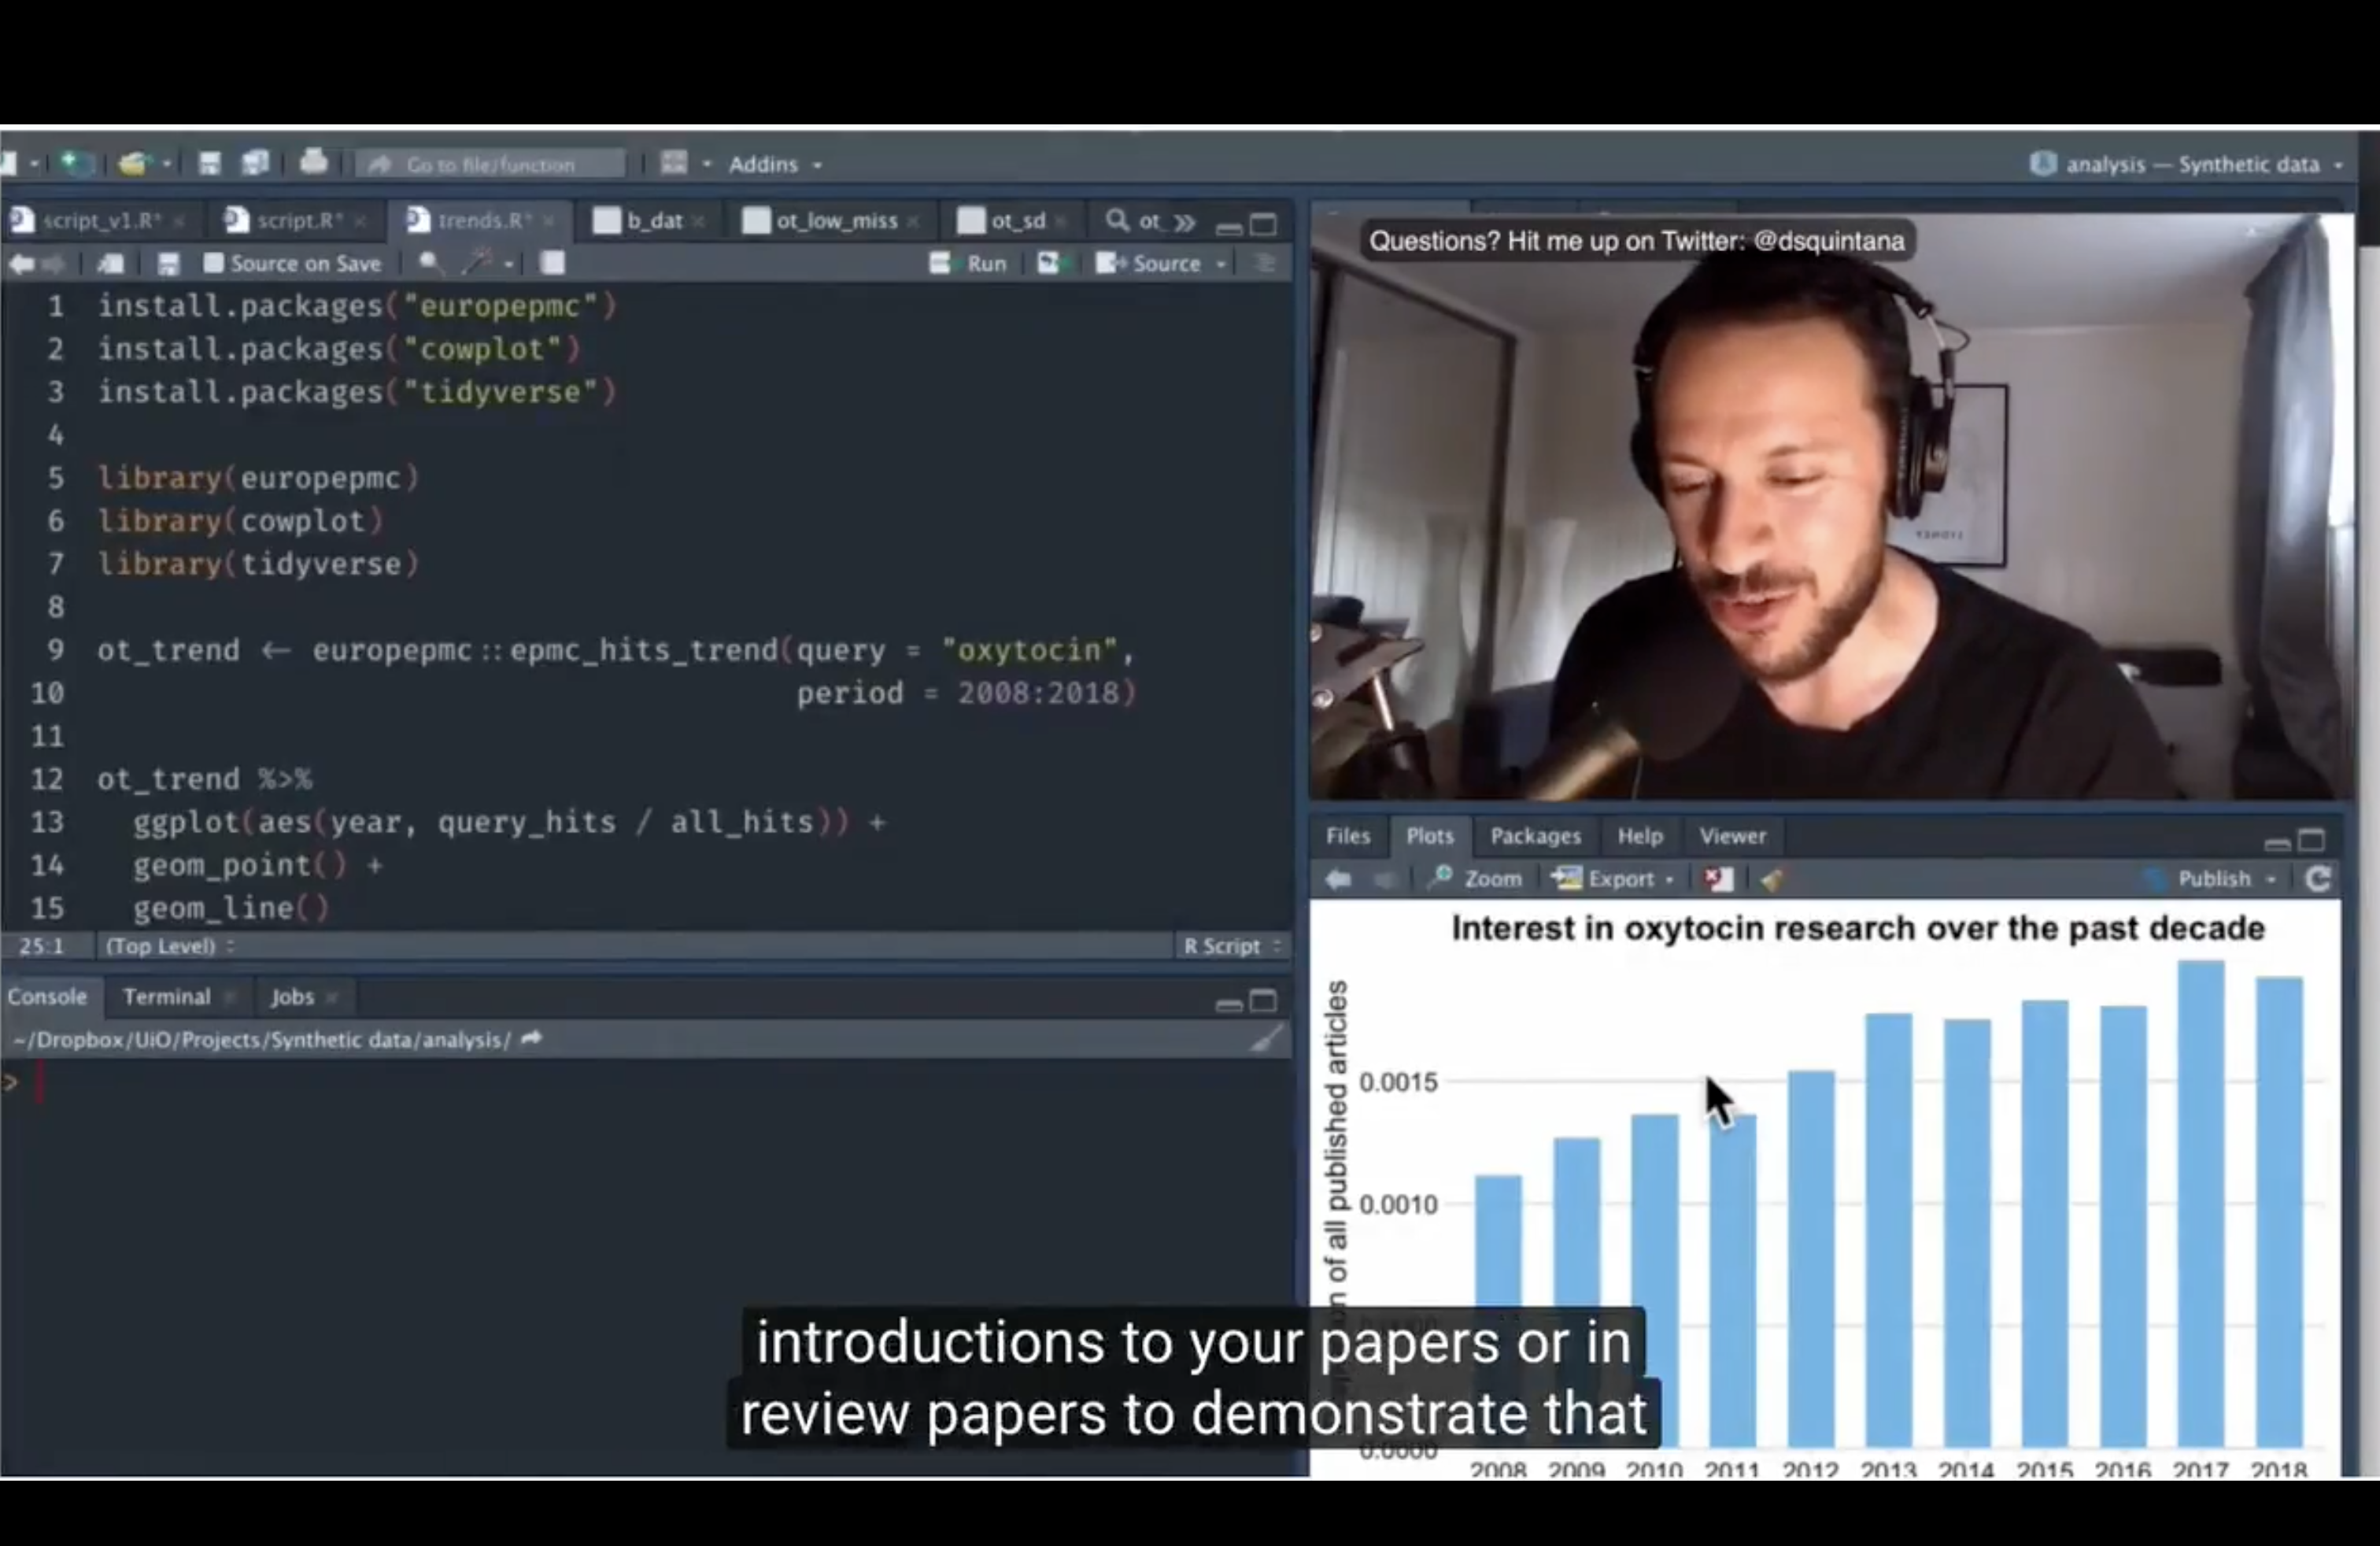
Visualizing research trends
statistics
video
Aug 13, 2025
(What to do) When Predictors Co-Vary
statistics
blog
Aug 13, 2025
Data Manipulation
wrangling
statistics
Aug 13, 2025
Sharing on Short Notice_How to get your teaching materials online with R Markdown
teaching r
slides
Aug 13, 2025
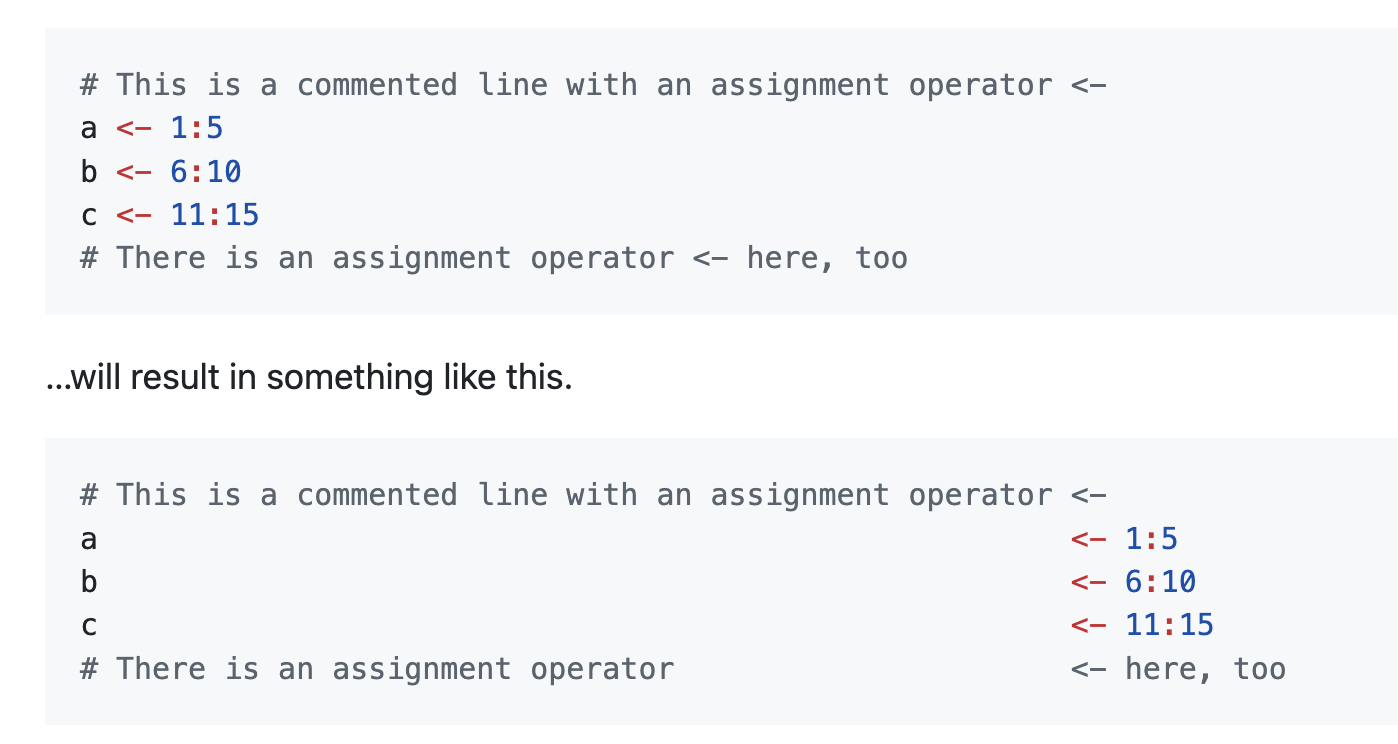
Align the assignment operators within a highlighted area
visualization
Joscelin’s fav
Aug 10, 2025
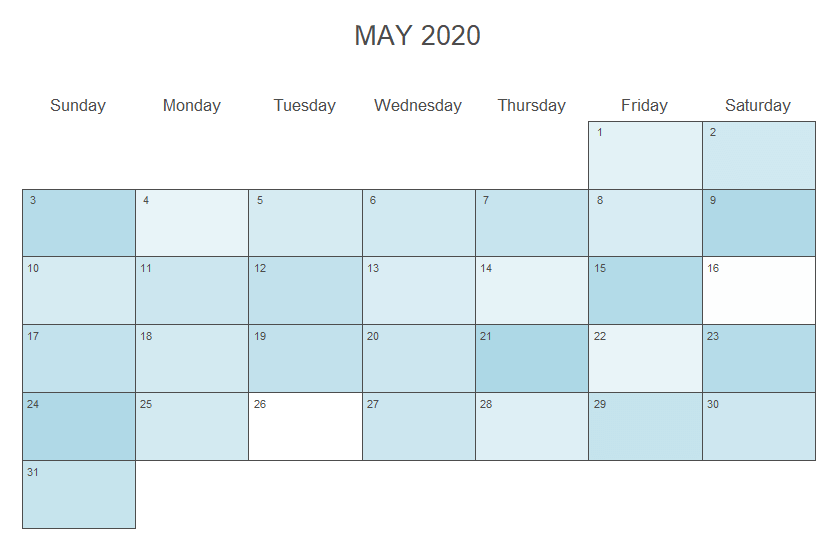
Calendar plot in R using ggplot2
visualization
package
Aug 2, 2025
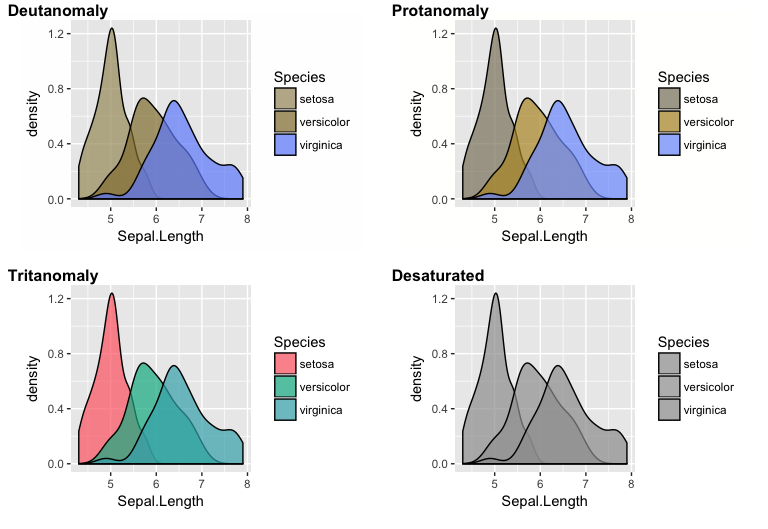
colorblindcheck
visualization
package
Aug 2, 2025
mall
llm
package
Joscelin’s fav
Jun 16, 2025
officeverse
book
package
Jun 2, 2025
Data analysis and plotting
markdown
Jun 1, 2025
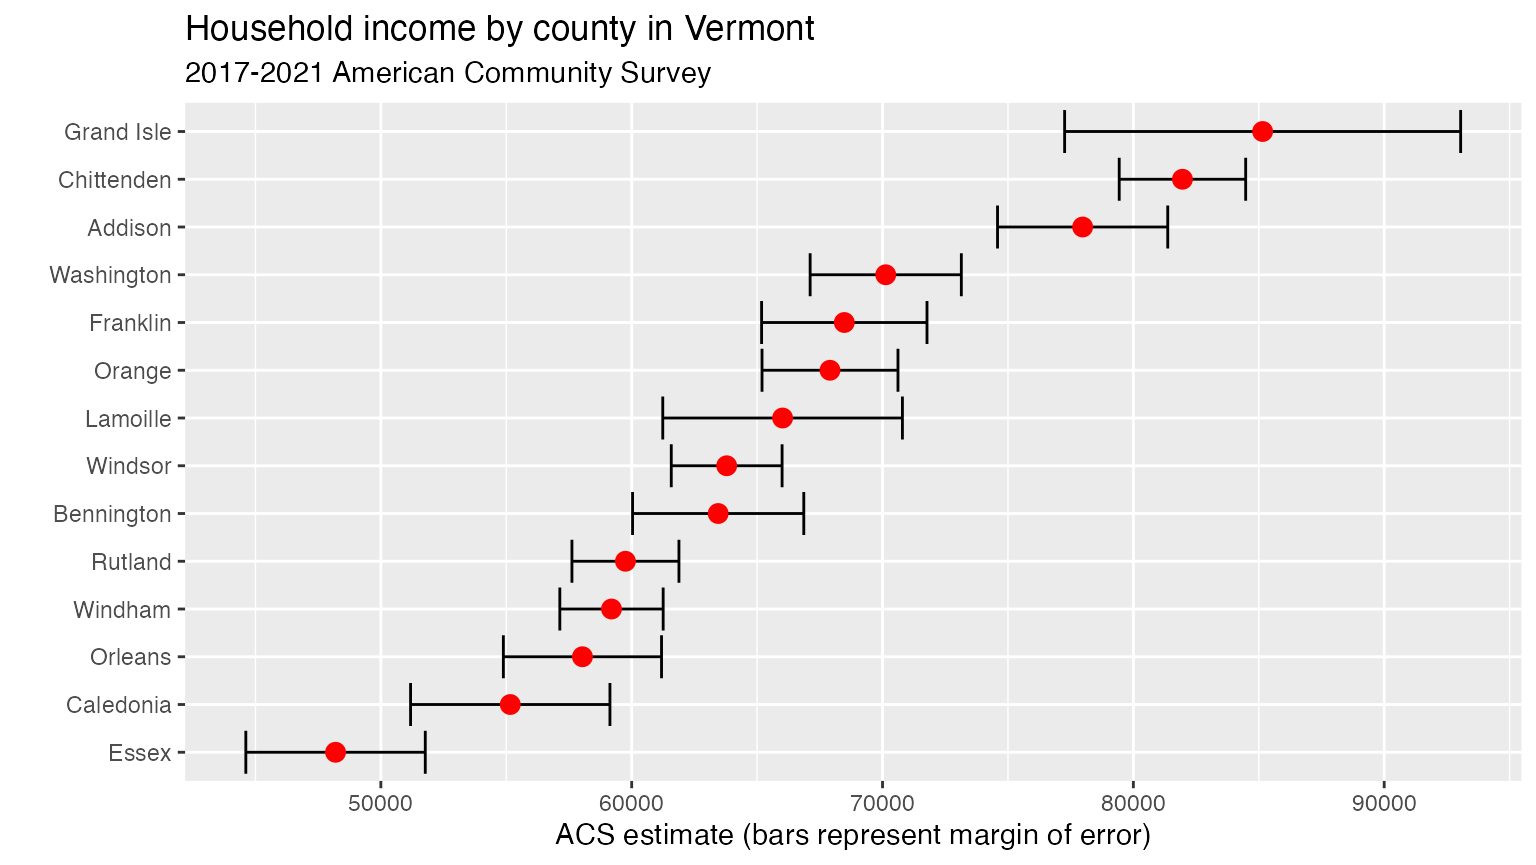
Tidycensus will convince you to learn R
package
May 28, 2025
Mapping and geographic data analysis with the simple features package in R
visualization
geospatial
May 25, 2025
Spatial Analysis in R - NICAR 2025 🗺️
visualization
geospatial
May 25, 2025
Introduction to R
intro
learning R
May 25, 2025
Coding togetheR
learning R
book
intro
May 24, 2025
COMP/STAT 112 Macalester College
learning R
intro
May 24, 2025
The Power of Internal Packages
learning R
package
tidyverse
May 24, 2025
Designing and Deploying Internal Quarto Templates
quarto
May 24, 2025
Producing and Using Data in Cognitive Science
learning R
data science
intro
book
statistics
wrangling
tidyverse
meta-analysis
May 24, 2025
DataEditR by Dillon Hammill
Joscelin’s fav
wrangling
package
May 23, 2025
fable: Time Series Forecasting Models
Joscelin’s fav
package
statistics
May 23, 2025
parameters: Process Statistical Model Parameters
Joscelin’s fav
package
statistics
bayesian
May 23, 2025
widyr: Widen, Process, and Re-Tidy a Dataset
Joscelin’s fav
May 23, 2025
lintr
package
style
May 22, 2025
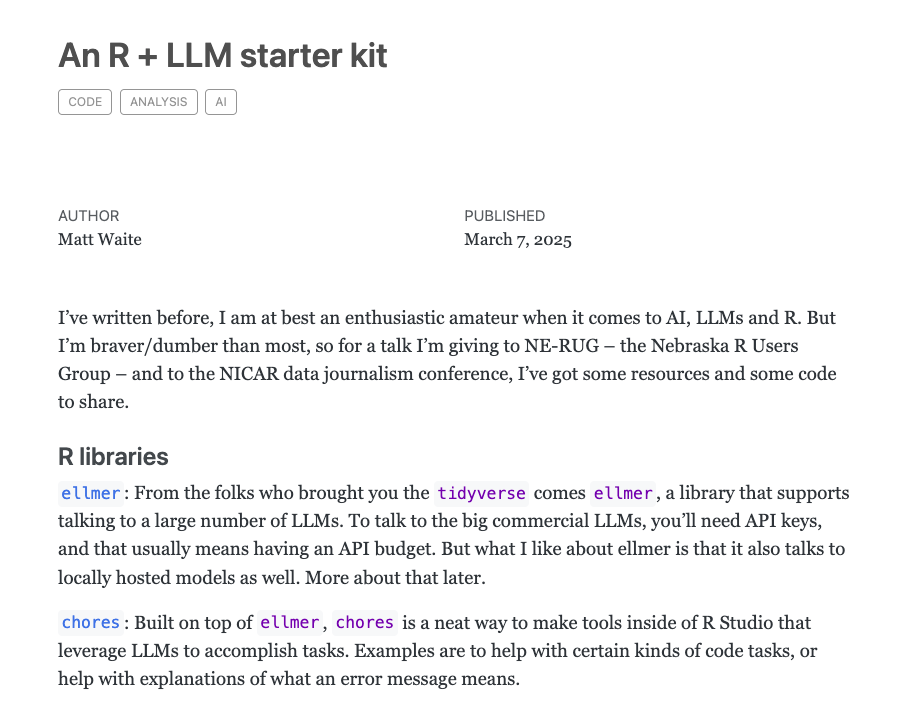
An R + LLM starter kit
llm
blog
May 20, 2025
The Dot-Probe Task is Probably Fine
bayesian
statistics
psychometrics
tutorial
May 20, 2025
Open Data from city of New York
datasets
May 19, 2025
Package ‘pain21’
datasets
May 19, 2025
Animated versions of common dplyr functions
tricks
May 19, 2025
Deploy Flexdashboard on Github Pages with Github Actions and Dockerfor R Users
docker
May 5, 2025
colorblindr
Joscelin’s fav
visualization
Apr 22, 2025
funneljoin: Time-Based Joins for Event Sequences
Joscelin’s fav
wrangling
package
Apr 22, 2025
pipediff
Joscelin’s fav
package
Apr 22, 2025
A gentle crash course in R using tidyverse
learning R
tidyverse
Apr 22, 2025
Advanced R
learning R
book
Apr 22, 2025
Beginner’s Guide to R
learning R
intro
Apr 22, 2025
Efficient R programming
learning R
book
Apr 22, 2025
Keeping it Tidy
learning R
tidyverse
wrangling
visualization
intro
Apr 22, 2025
Fundamentals of R Workshop Materials
learning R
intro
statistics
Apr 22, 2025
Forecasting: Principles and Practice
learning R
book
Apr 22, 2025
Get R Done | R Stats Tutorials
learning R
video
intro
Apr 22, 2025
Getting Started with R
learning R
intro
Joscelin’s fav
Apr 22, 2025
Hands-On Programming
learning R
book
intro
wrangling
Apr 22, 2025
Introduction to data.table
learning R
Apr 22, 2025
Introduction to dplyr
learning R
tidyverse
intro
package
Apr 22, 2025
Introduction to R for Statistics and Data Science
learning R
course
statistics
data science
Apr 22, 2025
Intro to R for Biologists
learning R
intro
Apr 22, 2025
Just Enough R
learning R
book
intro
Apr 22, 2025
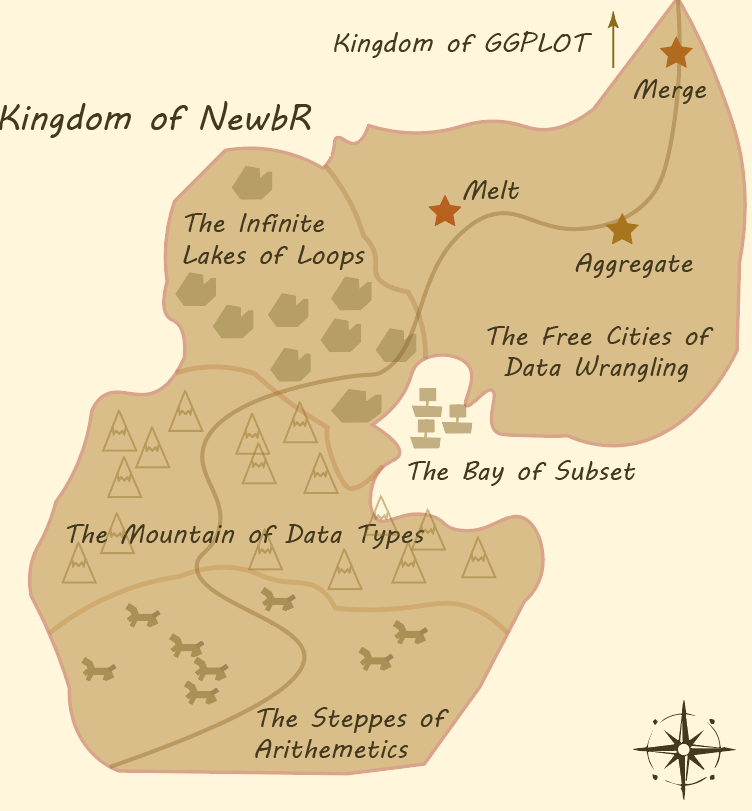
Kingdom of NewbR: An introduction to R
learning R
intro
wrangling
Apr 22, 2025
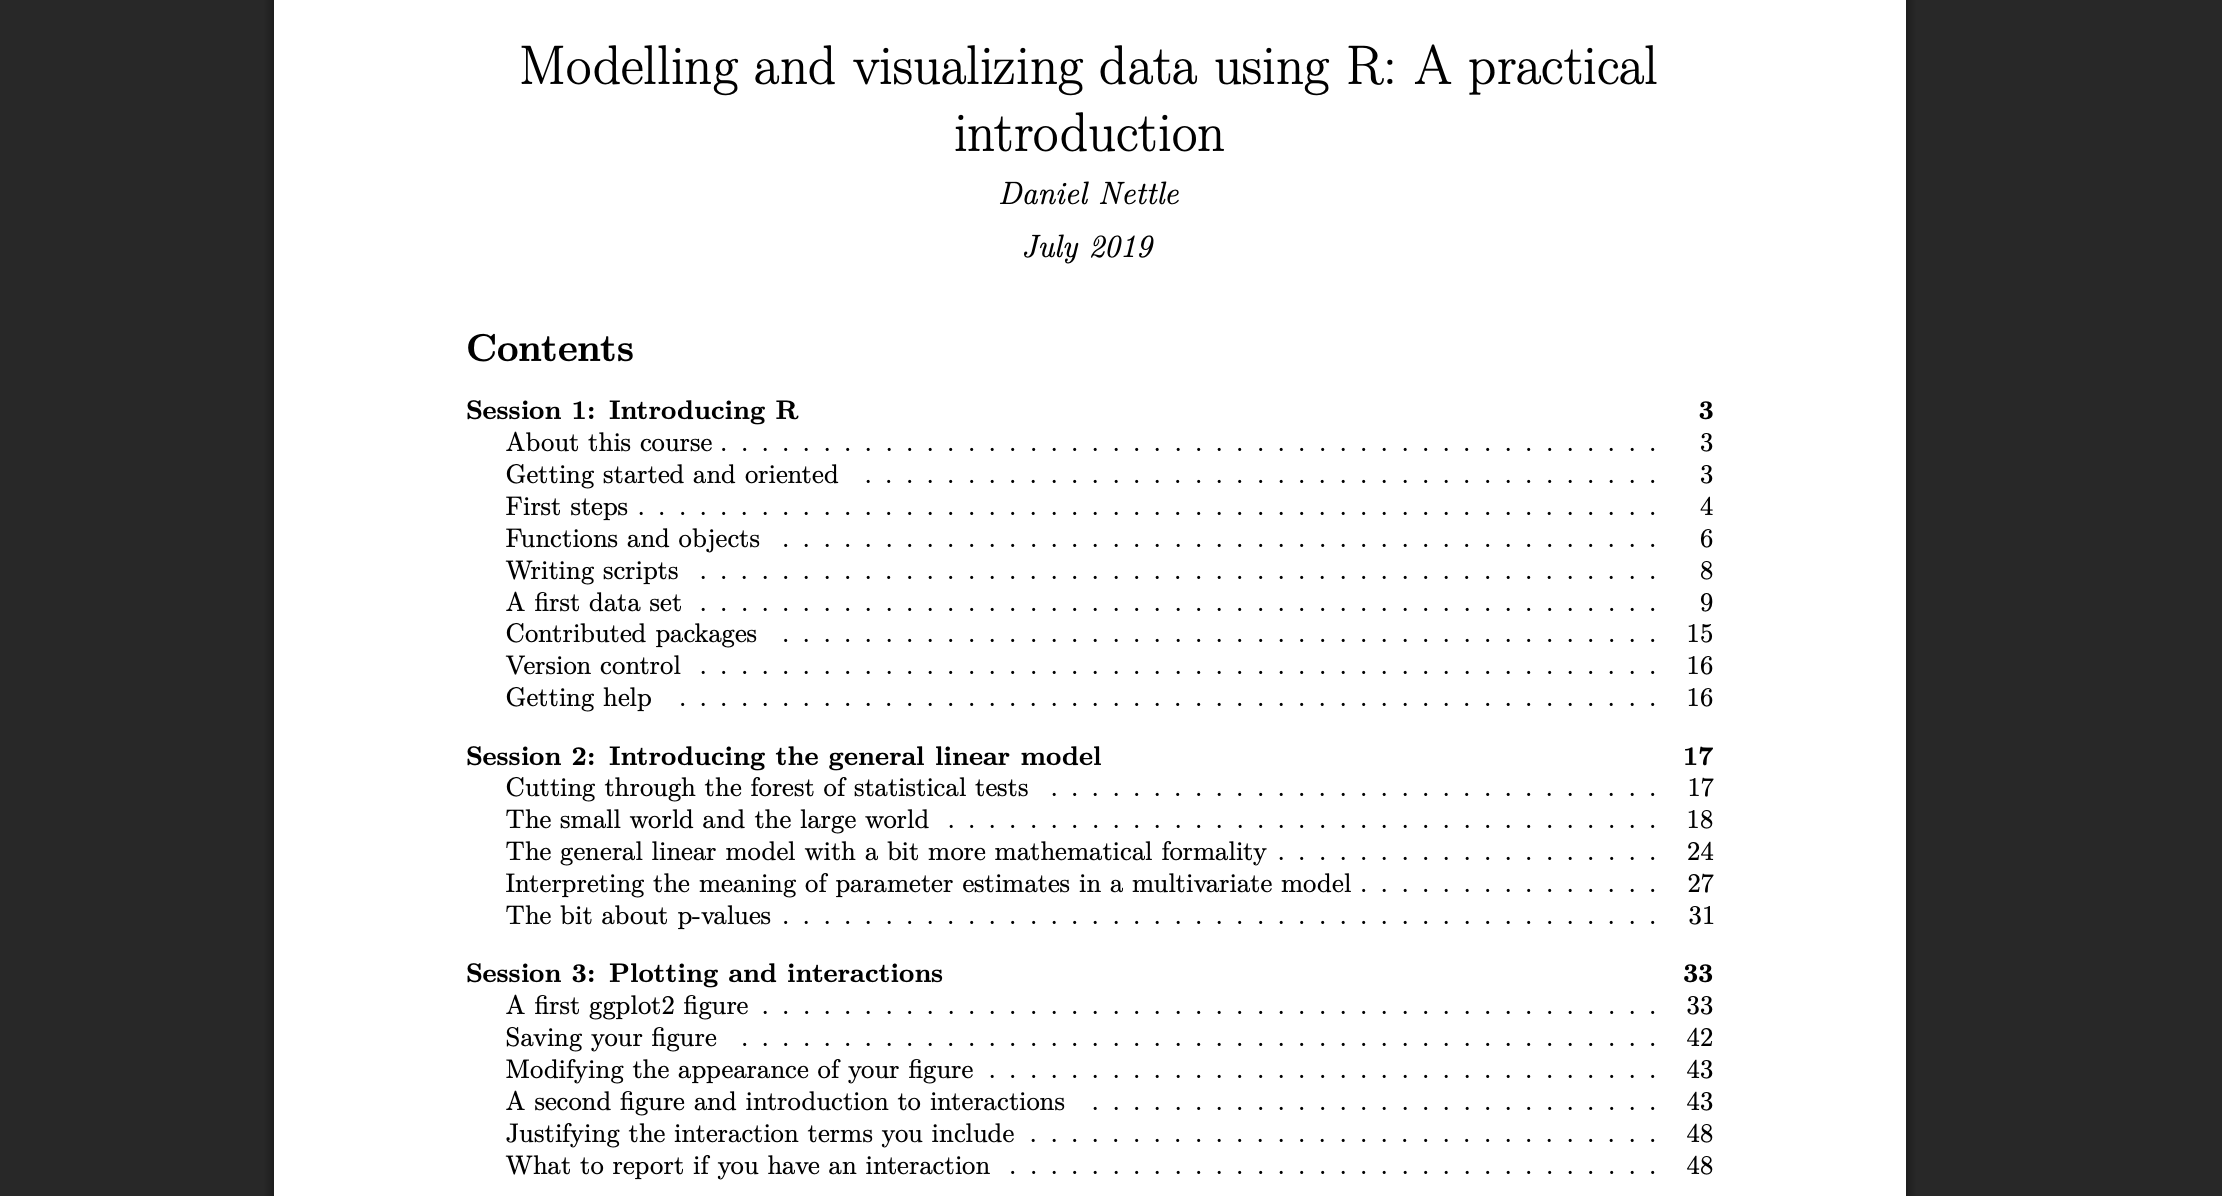
Modelling and visualizing data using R: A practical introduction
learning R
intro
visualization
modeling
statistics
Apr 22, 2025
Programming with R
learning R
intro
course
Apr 22, 2025
R best practices
learning R
Apr 22, 2025
R Bootcamp
learning R
intro
course
visualization
tidyverse
Apr 22, 2025
R for Psychological Science
learning R
intro
statistics
Apr 22, 2025
Learning Statistics with R
learning R
intro
statistics
Apr 22, 2025
Remaster the Tidyverse
learning R
tidyverse
Apr 22, 2025
R-Ladies #LdnOnt Materials
learning R
intro
statistics
wrangling
visualization
Apr 22, 2025
R Tutorial
learning R
visualization
statistics
wrangling
Apr 22, 2025
Swirl
learning R
intro
teaching r
Apr 22, 2025
Teacup Giraffes_Before the Adventure Begins: INTRO TO R
learning R
intro
statistics
Joscelin’s fav
Apr 22, 2025
The Tidyverse Cookbook
learning R
tidyverse
book
data science
wrangling
visualization
Apr 22, 2025
The Tidyverse Style Guide
learning R
git
github
style
tidyverse
Apr 22, 2025
Tidy Modeling with R
learning R
book
modeling
Apr 22, 2025
Tidy Tuesday by David Robinson
learning R
Joscelin’s fav
visualization
video
Apr 22, 2025
Tidyverse tutorial (2017)
learning R
tidyverse
intro
Apr 22, 2025
Using R for Data Journalism
learning R
course
statistics
visualization
geospatial
Apr 22, 2025
What They Forgot to Teach You About R
learning R
API
workflows
Apr 22, 2025
YaRrr! The Pirate’s Guide
learning R
book
intro
statistics
wrangling
visualization
Apr 22, 2025
Introduction to Machine Learning with the Tidyverse
machine learning
intro
Joscelin’s fav
Apr 22, 2025
Supervised Machine Learning case studies in R
machine learning
modeling
course
Apr 22, 2025
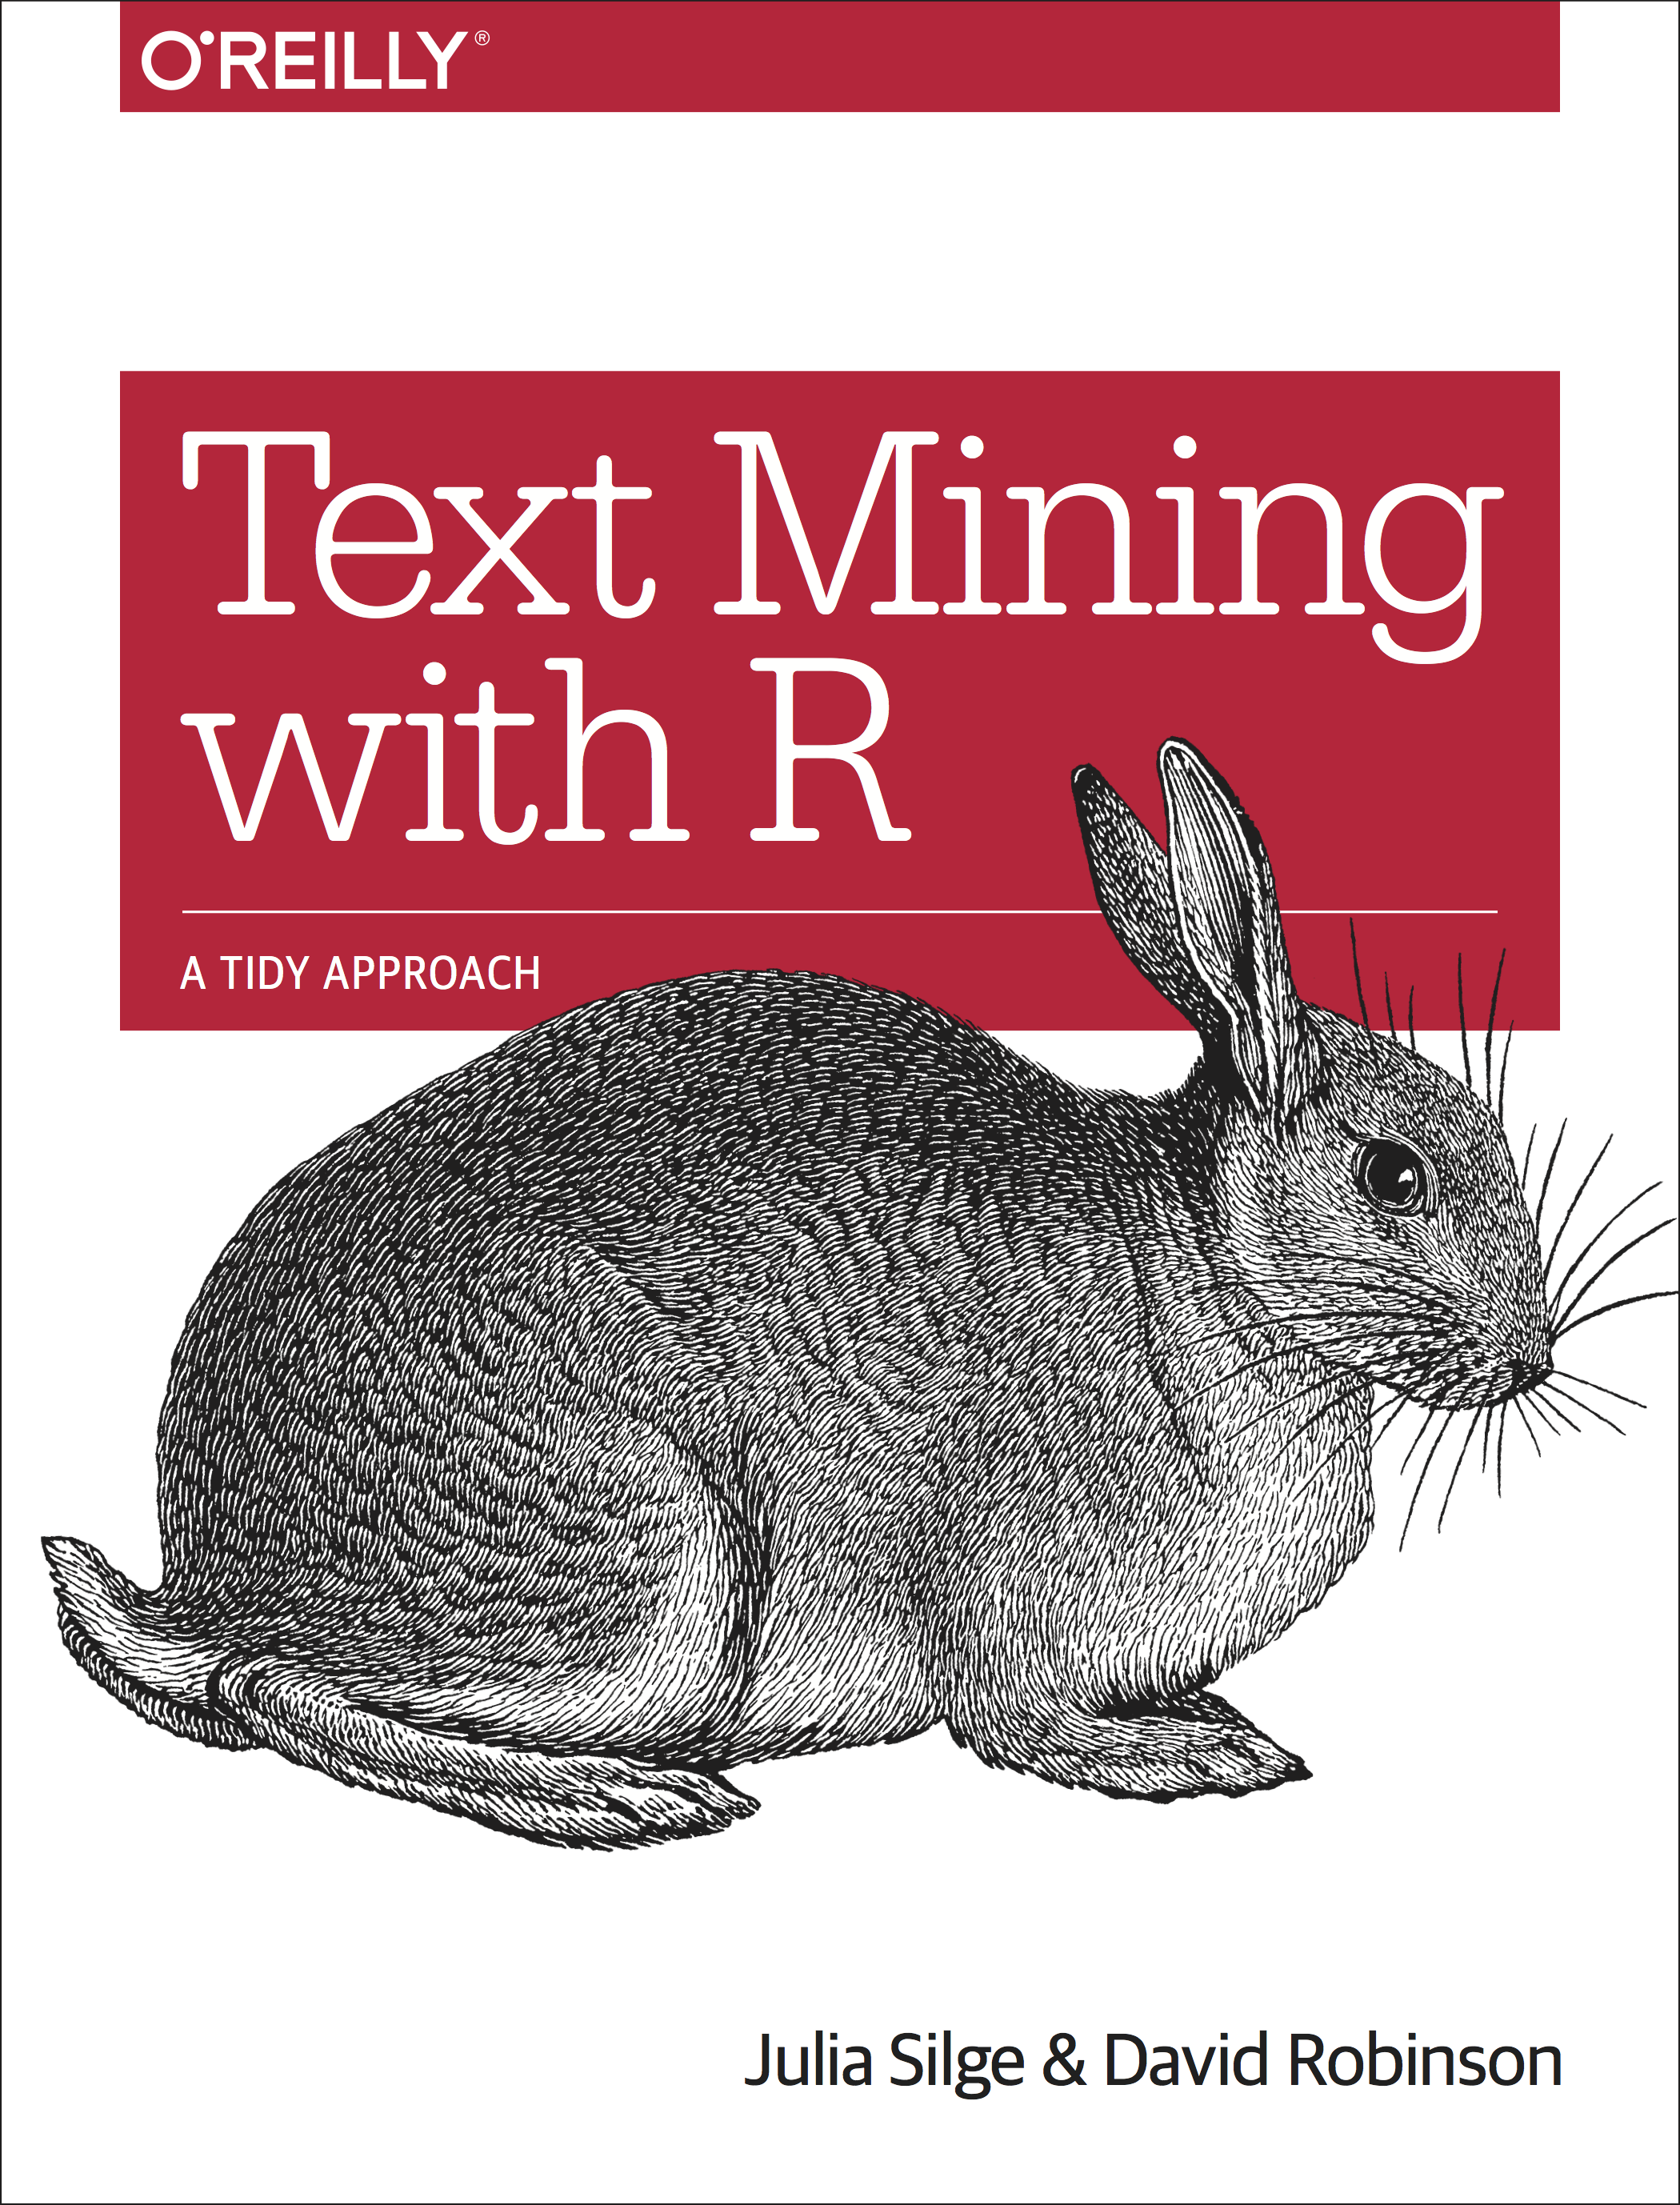
Supervised Machine Learning for Text Analysis in R
machine learning
book
modeling
Apr 22, 2025
Tidymodels, Virtually: An Introduction to Machine Learning with Tidymodels
machine learning
modeling
course
Apr 22, 2025
blogdown: Creating Websites with R Markdown
websites
book
Apr 22, 2025
How to make your own website for free in under an hour
websites
tutorial
Joscelin’s fav
Apr 22, 2025
How to build your personal academic website using opensource software
websites
Apr 22, 2025
Mastering Shiny
websites
shiny
dashboards
Apr 22, 2025
Systematic Literature Review with quantitative analysis of scientific production: Scientometrics using R
meta-analysis
statistics
book
Apr 22, 2025
Doing Meta-Analysis in R A Hands-on Guide
meta-analysis
book
statistics
Joscelin’s fav
Apr 22, 2025
R Code for Meta-Analysis Books
meta-analysis
Apr 22, 2025
Create your own R package-R Packages
package
Apr 22, 2025
R package primer a minimal tutorial
package
Apr 22, 2025
Writing an R package from scratch
package creation
Apr 22, 2025
Make your slides extra special
slides
Apr 22, 2025
PowerPoint presentations generation Vignettes
slides
Apr 22, 2025
Sharing Your xaringan Slides
slides
Apr 22, 2025
The Ultimate Infinite Moon Reader for xaringan Slides
slides
Apr 22, 2025
XaringanExtra: See slides as tiles & more
slides
Apr 22, 2025
xaringan Tip: Add A Logo to All of Your Slides
slides
Apr 22, 2025
vitae: Templates and tools for making a Résumé/CV
cv
package
Apr 22, 2025
Quarto demos
quarto
Apr 22, 2025
ggsegExtra
neuro
Apr 22, 2025
R Markdown Cookbook
markdown
book
Joscelin’s fav
Apr 22, 2025
12 Months of aRt
art
visualization
Apr 21, 2025
Frankenstein: Voronoi tesselation example
art
visualization
Apr 21, 2025
Script to make ascii art from images in ggplot
art
visualization
Apr 21, 2025
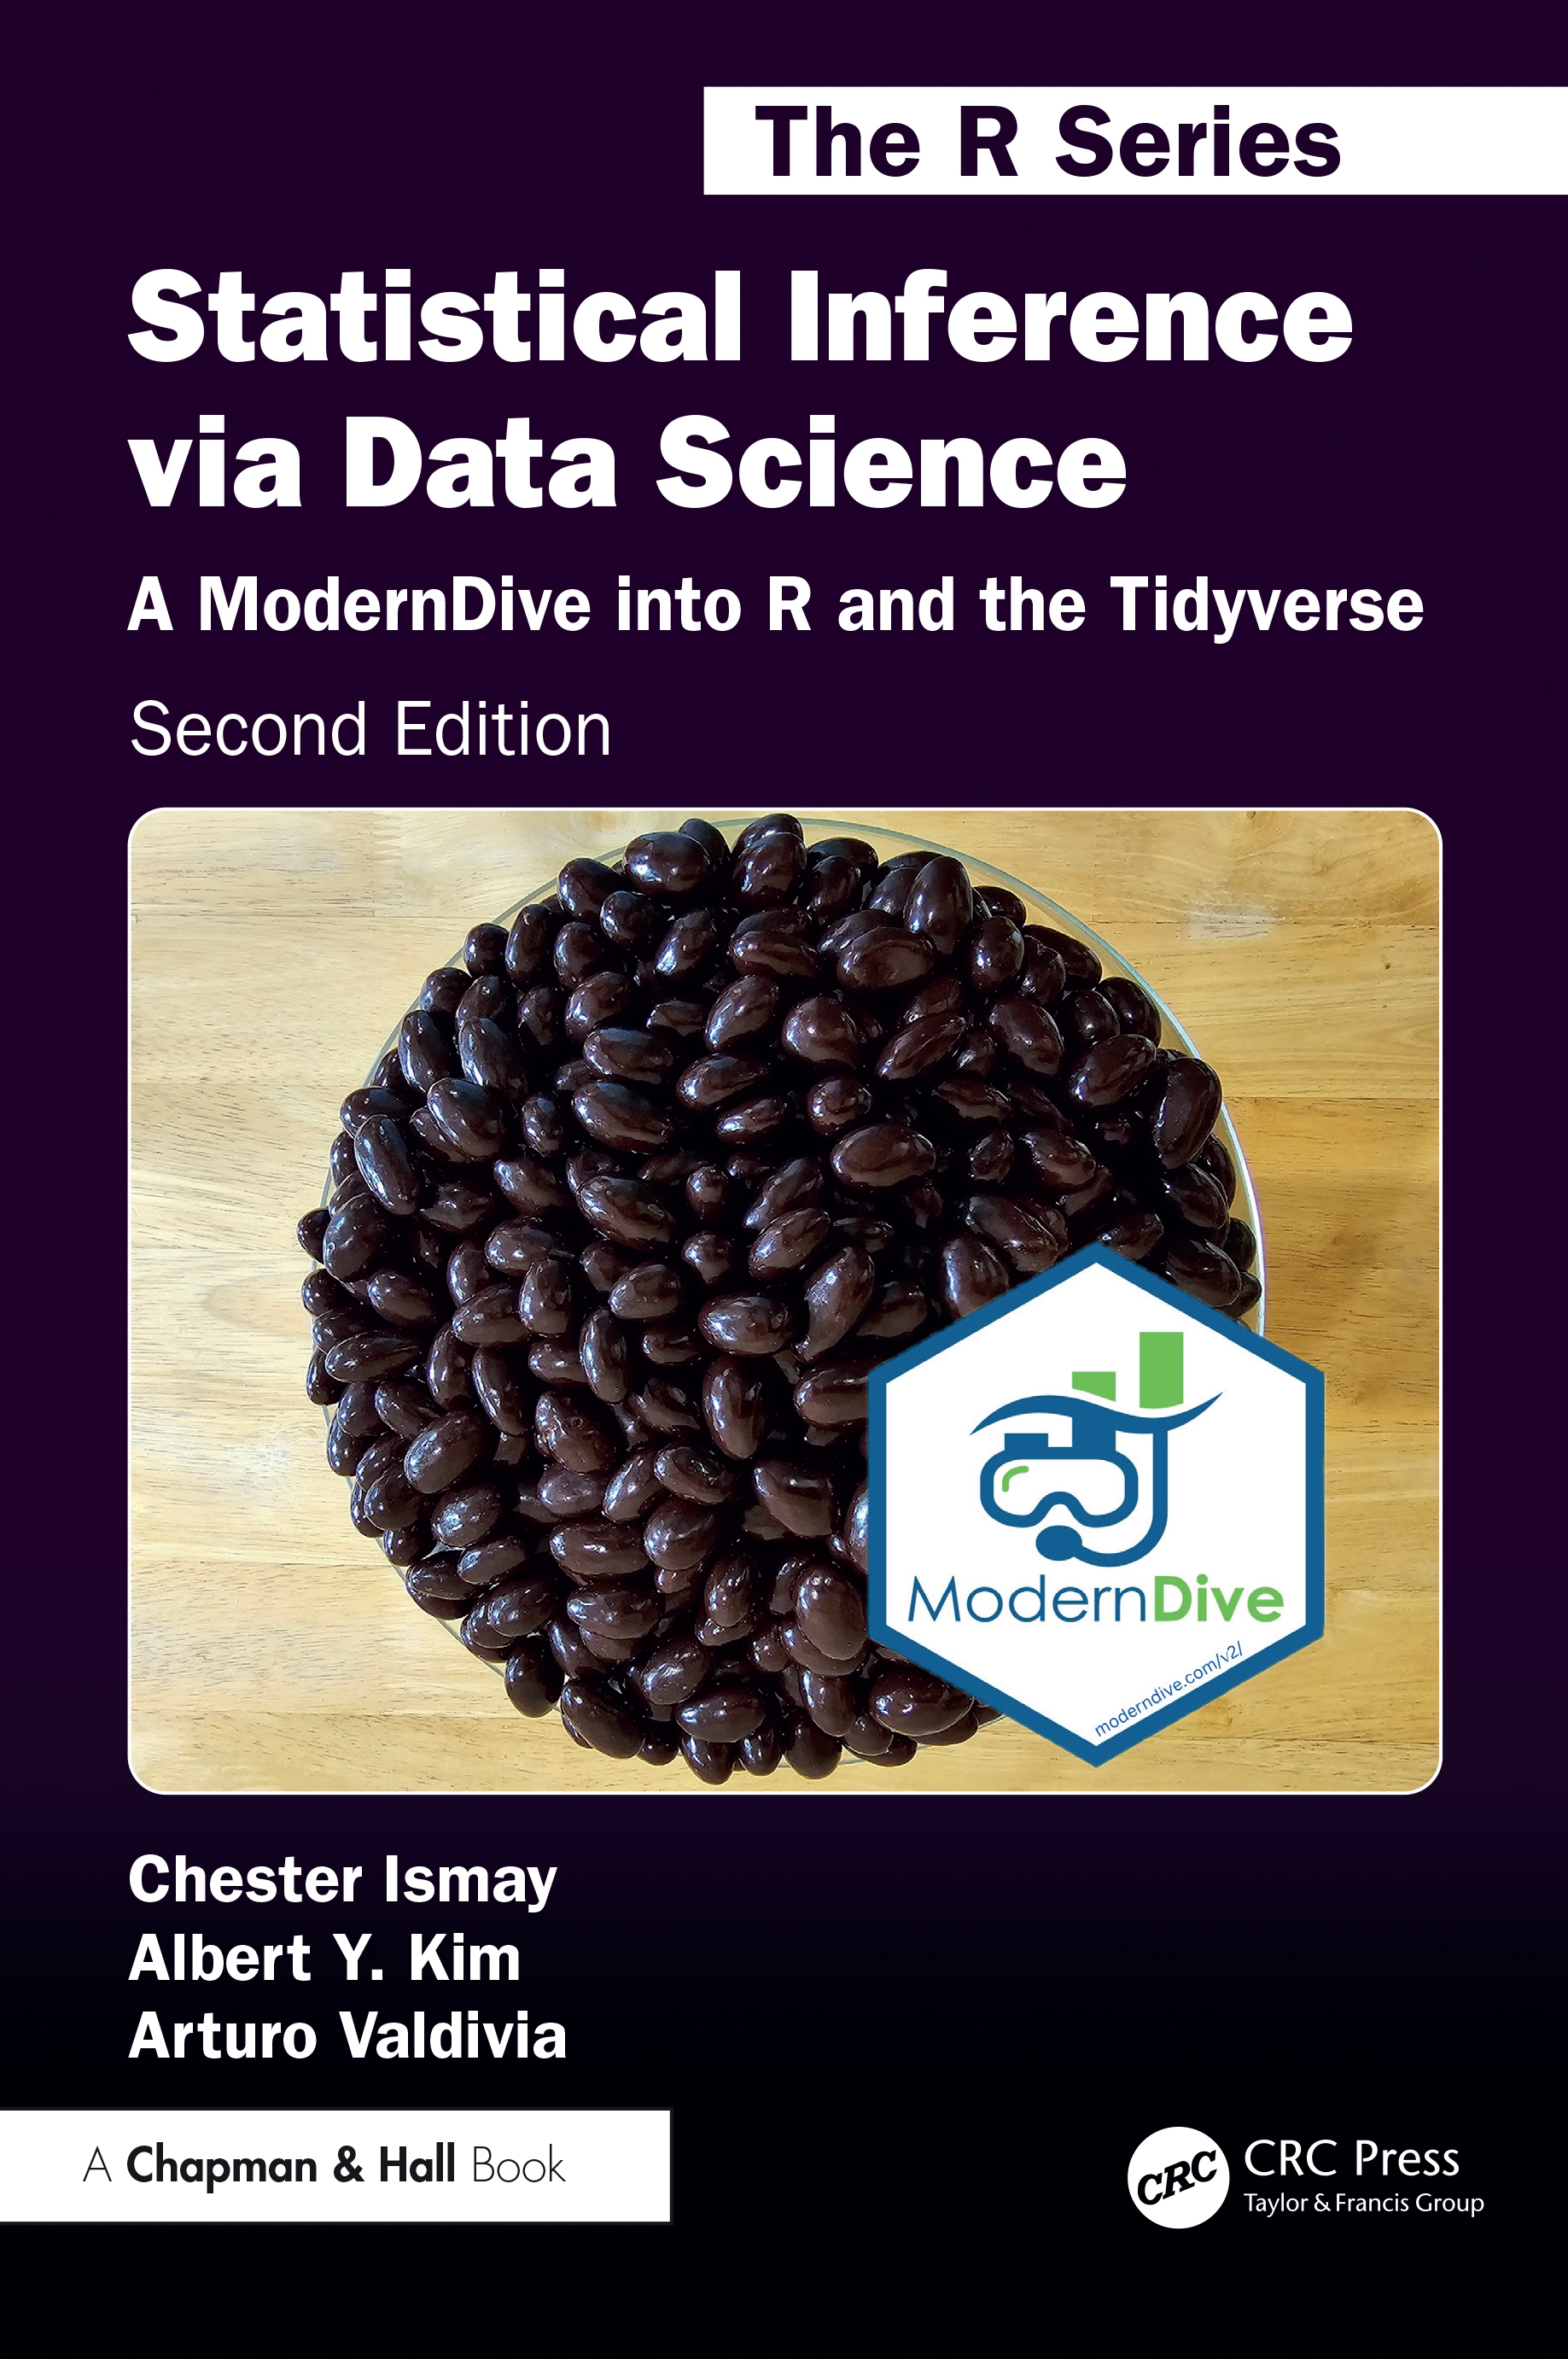
A ModernDive into R & the Tidyverse
book
data science
tidyverse
visualization
wrangling
modeling
statistics
Apr 21, 2025
Data Analysis for the Life Sciences with R
book
statistics
Apr 21, 2025
Data Science for Economists Seminar
data science
course
Apr 21, 2025
Data Science with R
course
data science
Apr 21, 2025
Data Skill for Reproducible science
statistics
wrangling
data science
visualization
Apr 21, 2025
Exploratory Data Analysis with R
book
statistics
tidyverse
Apr 21, 2025
Advanced Data Science 2020
data science
book
statistics
Apr 4, 2025
Managing complicated research workflows in R with {targets} [February 2025]
workflows
Feb 27, 2025
ellmer: Chat with Large Language Models
Joscelin’s fav
package
llm
tidyverse
Feb 20, 2025
tidycountries: Access and Manipulate Country-Level Data
Joscelin’s fav
datasets
package
Feb 20, 2025
An Introduction to R
learning R
book
intro
Feb 20, 2025
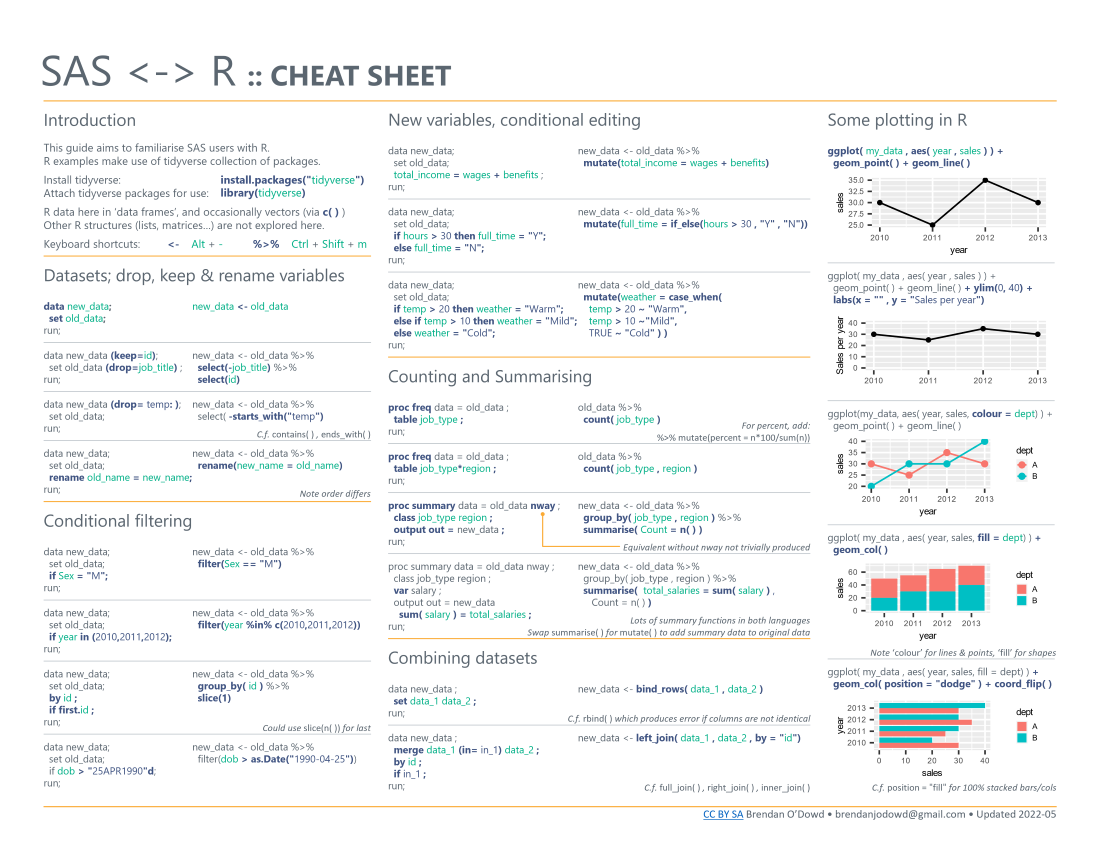
Learning R as a SAS User
learning R
Joscelin’s fav
sas
Feb 20, 2025
Posit Cheat Sheets
learning R
Feb 20, 2025
The R Workshop Book
learning R
statistics
visualization
intro
wrangling
Feb 20, 2025
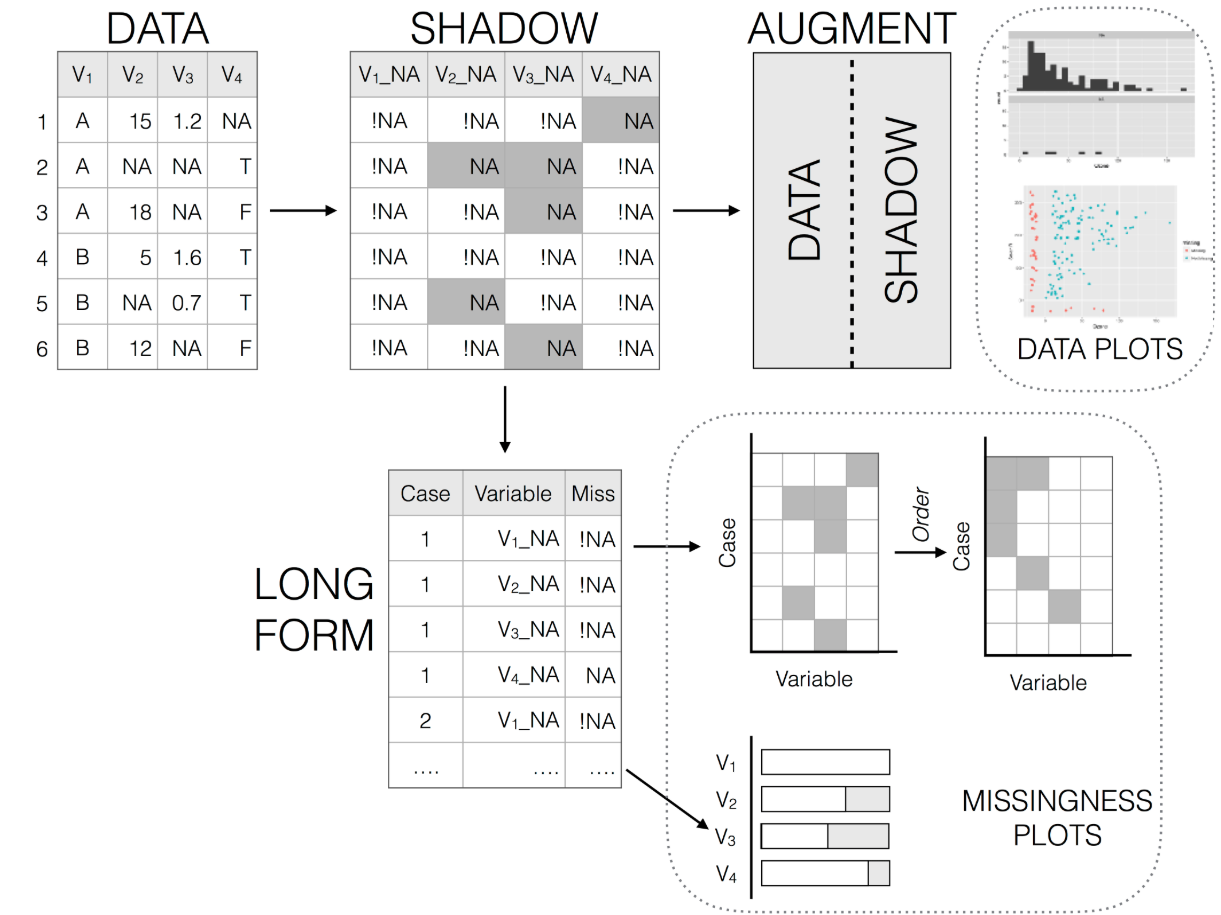
Getting Started with naniar
visualization
missing data
Mar 5, 2024
Re-constructing Google Forms responses with Quarto and {glue}
quarto
Aug 8, 2023
R Crash Course for Biologists
learning R
intro
book
May 28, 2023
Data Wrangling in the Tidyverse
video
wrangling
python
tidyverse
May 5, 2023
Art from Code
art
visualization
Apr 30, 2023
Art with R
art
visualization
Apr 30, 2023
Creating a blog with Quarto in 10 steps
websites
blog
quarto
Apr 30, 2023
Making shareable documents with Quarto
websites
tutorial
quarto
github
jupyter
Apr 30, 2023
The ultimate guide to starting a Quarto blog
websites
blog
quarto
Apr 30, 2023
Making shareable documents with Quarto
quarto
Apr 30, 2023
A Psychologist’s Guide to R
learning R
intro
Apr 28, 2023
A-Guided-Tour-of-R
learning R
course
intro
Apr 28, 2023
Data Science for Psychologists: A Refreshed Exploratory & Graphical Data Analysis in R
data science
statistics
course
Apr 28, 2023
R Course
learning R
intro
course
Apr 28, 2023
RYouWithMe
learning R
intro
visualization
Apr 28, 2023
Building reproducible analytical pipelines with R
book
data science
Apr 24, 2023
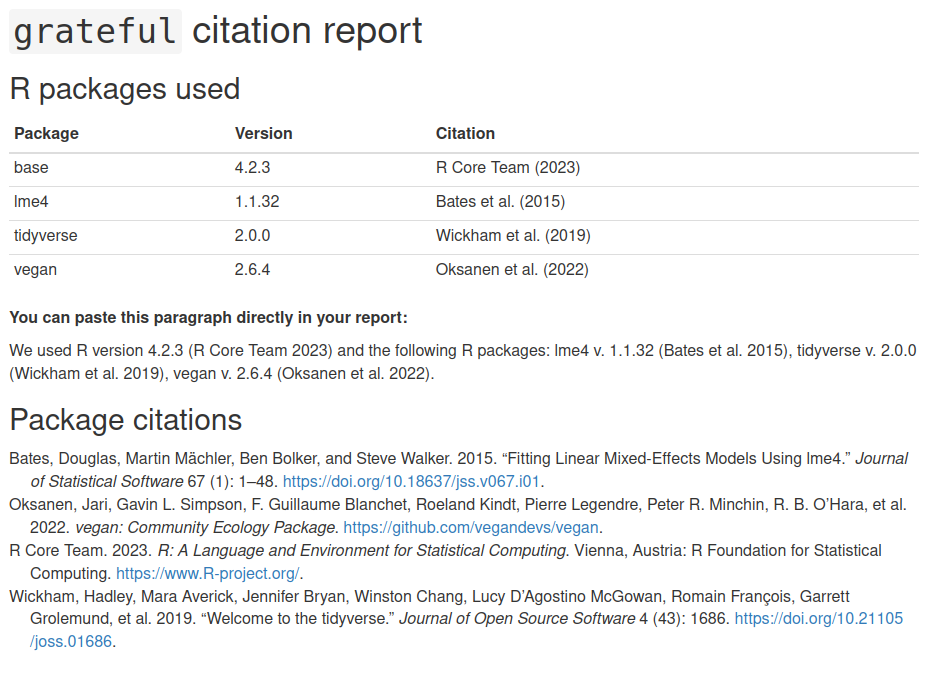
grateful: Facilitate Citation of R Packages
Joscelin’s fav
package
citation
Apr 24, 2023
R for Data Analysis
learning R
statistics
book
Apr 14, 2023
Statistical Computing at Johns Hopkins Bloomberg School of Public Health
learning R
package creation
intro
tidyverse
documentation
API
shiny
dashboards
statistics
Apr 14, 2023
Using R as a GIS: Preview: What Is R?
learning R
book
geospatial
book
Apr 14, 2023
rjtools: Preparing, Checking, and Submitting Articles to the ‘R Journal’
package
Apr 14, 2023
Data Science in a Box
data science
statistics
visualization
Jul 12, 2022
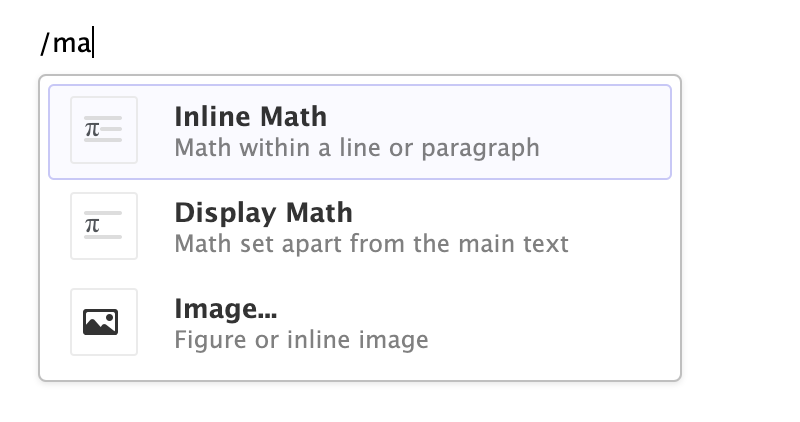
HTML blocks
html
Jul 9, 2022
a gRadual intRoduction to Shiny
slides
shiny
dashboards
Jul 4, 2022
Data Science in Education using R
book
data science
Mar 4, 2022
correlation: Perform Correlation Analysis
Joscelin’s fav
statistics
Feb 2, 2022
esquisse add-in
Joscelin’s fav
package
visualization
Feb 2, 2022
session_info: Print Session Information
Joscelin’s fav
Feb 2, 2022
xstitch: A package for creating cross-stitch charts
art
visualization
Oct 12, 2021
Getting Started in R – Tinyverse Edition
learning R
package
visualization
Oct 12, 2021
Hello Quarto
learning R
book
Oct 9, 2021
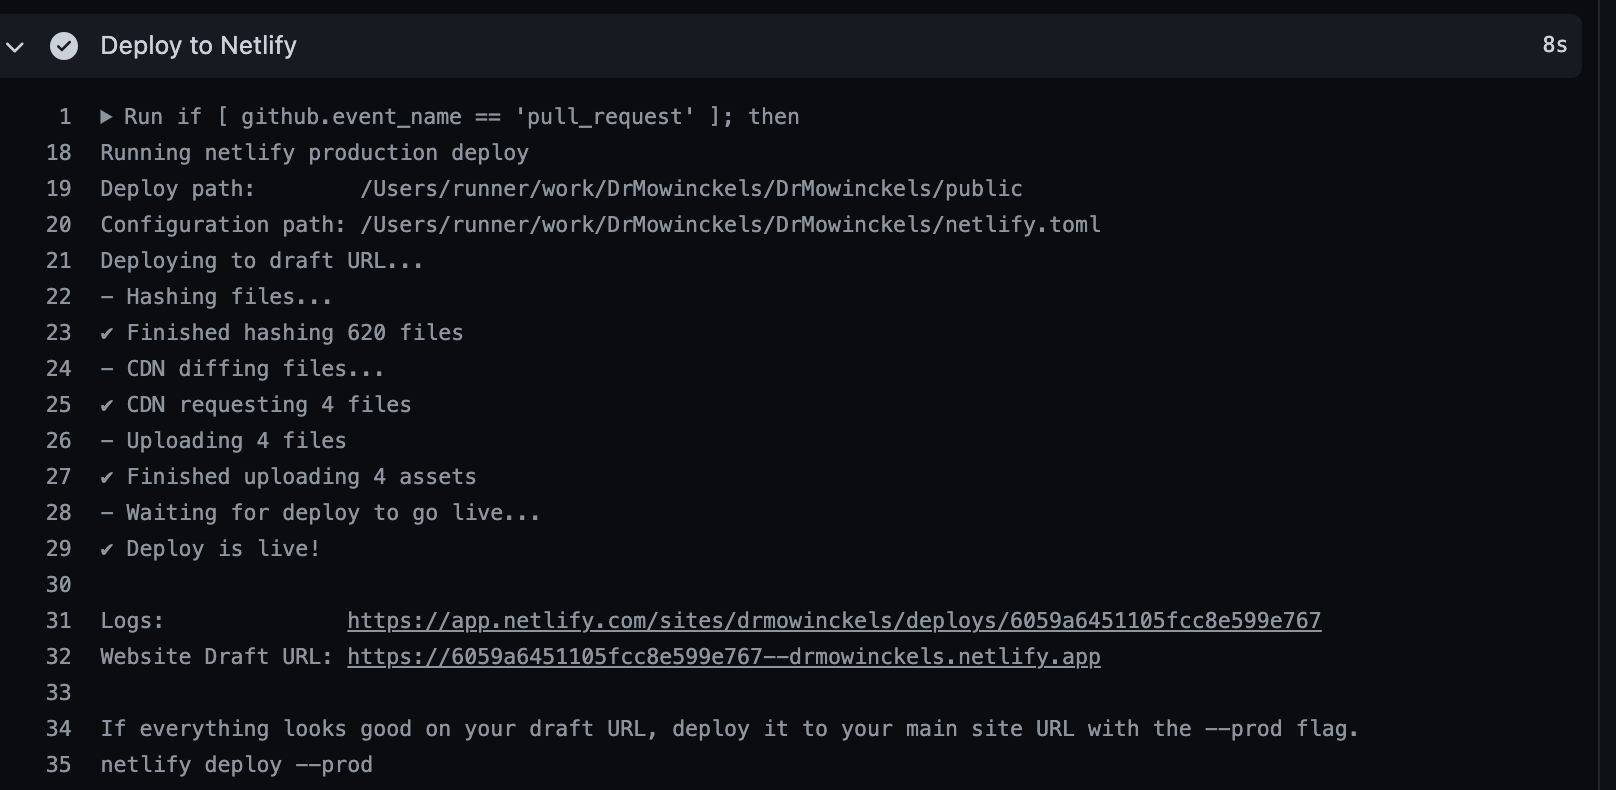
Using GitHub Actions to Build your Hugo Website
websites
git
github
Jun 6, 2021
Online R courses-Mainly free ones
learning R
intro
Joscelin’s fav
course
Apr 15, 2021
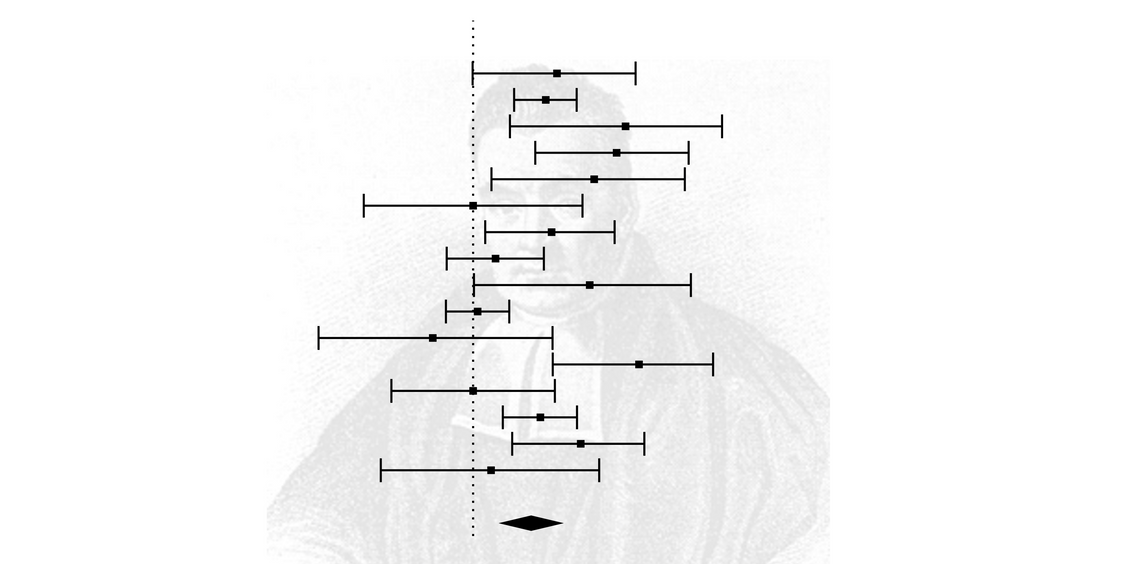
How to perform a Bayesian meta-analysis
meta-analysis
bayesian
statistics
Apr 1, 2021
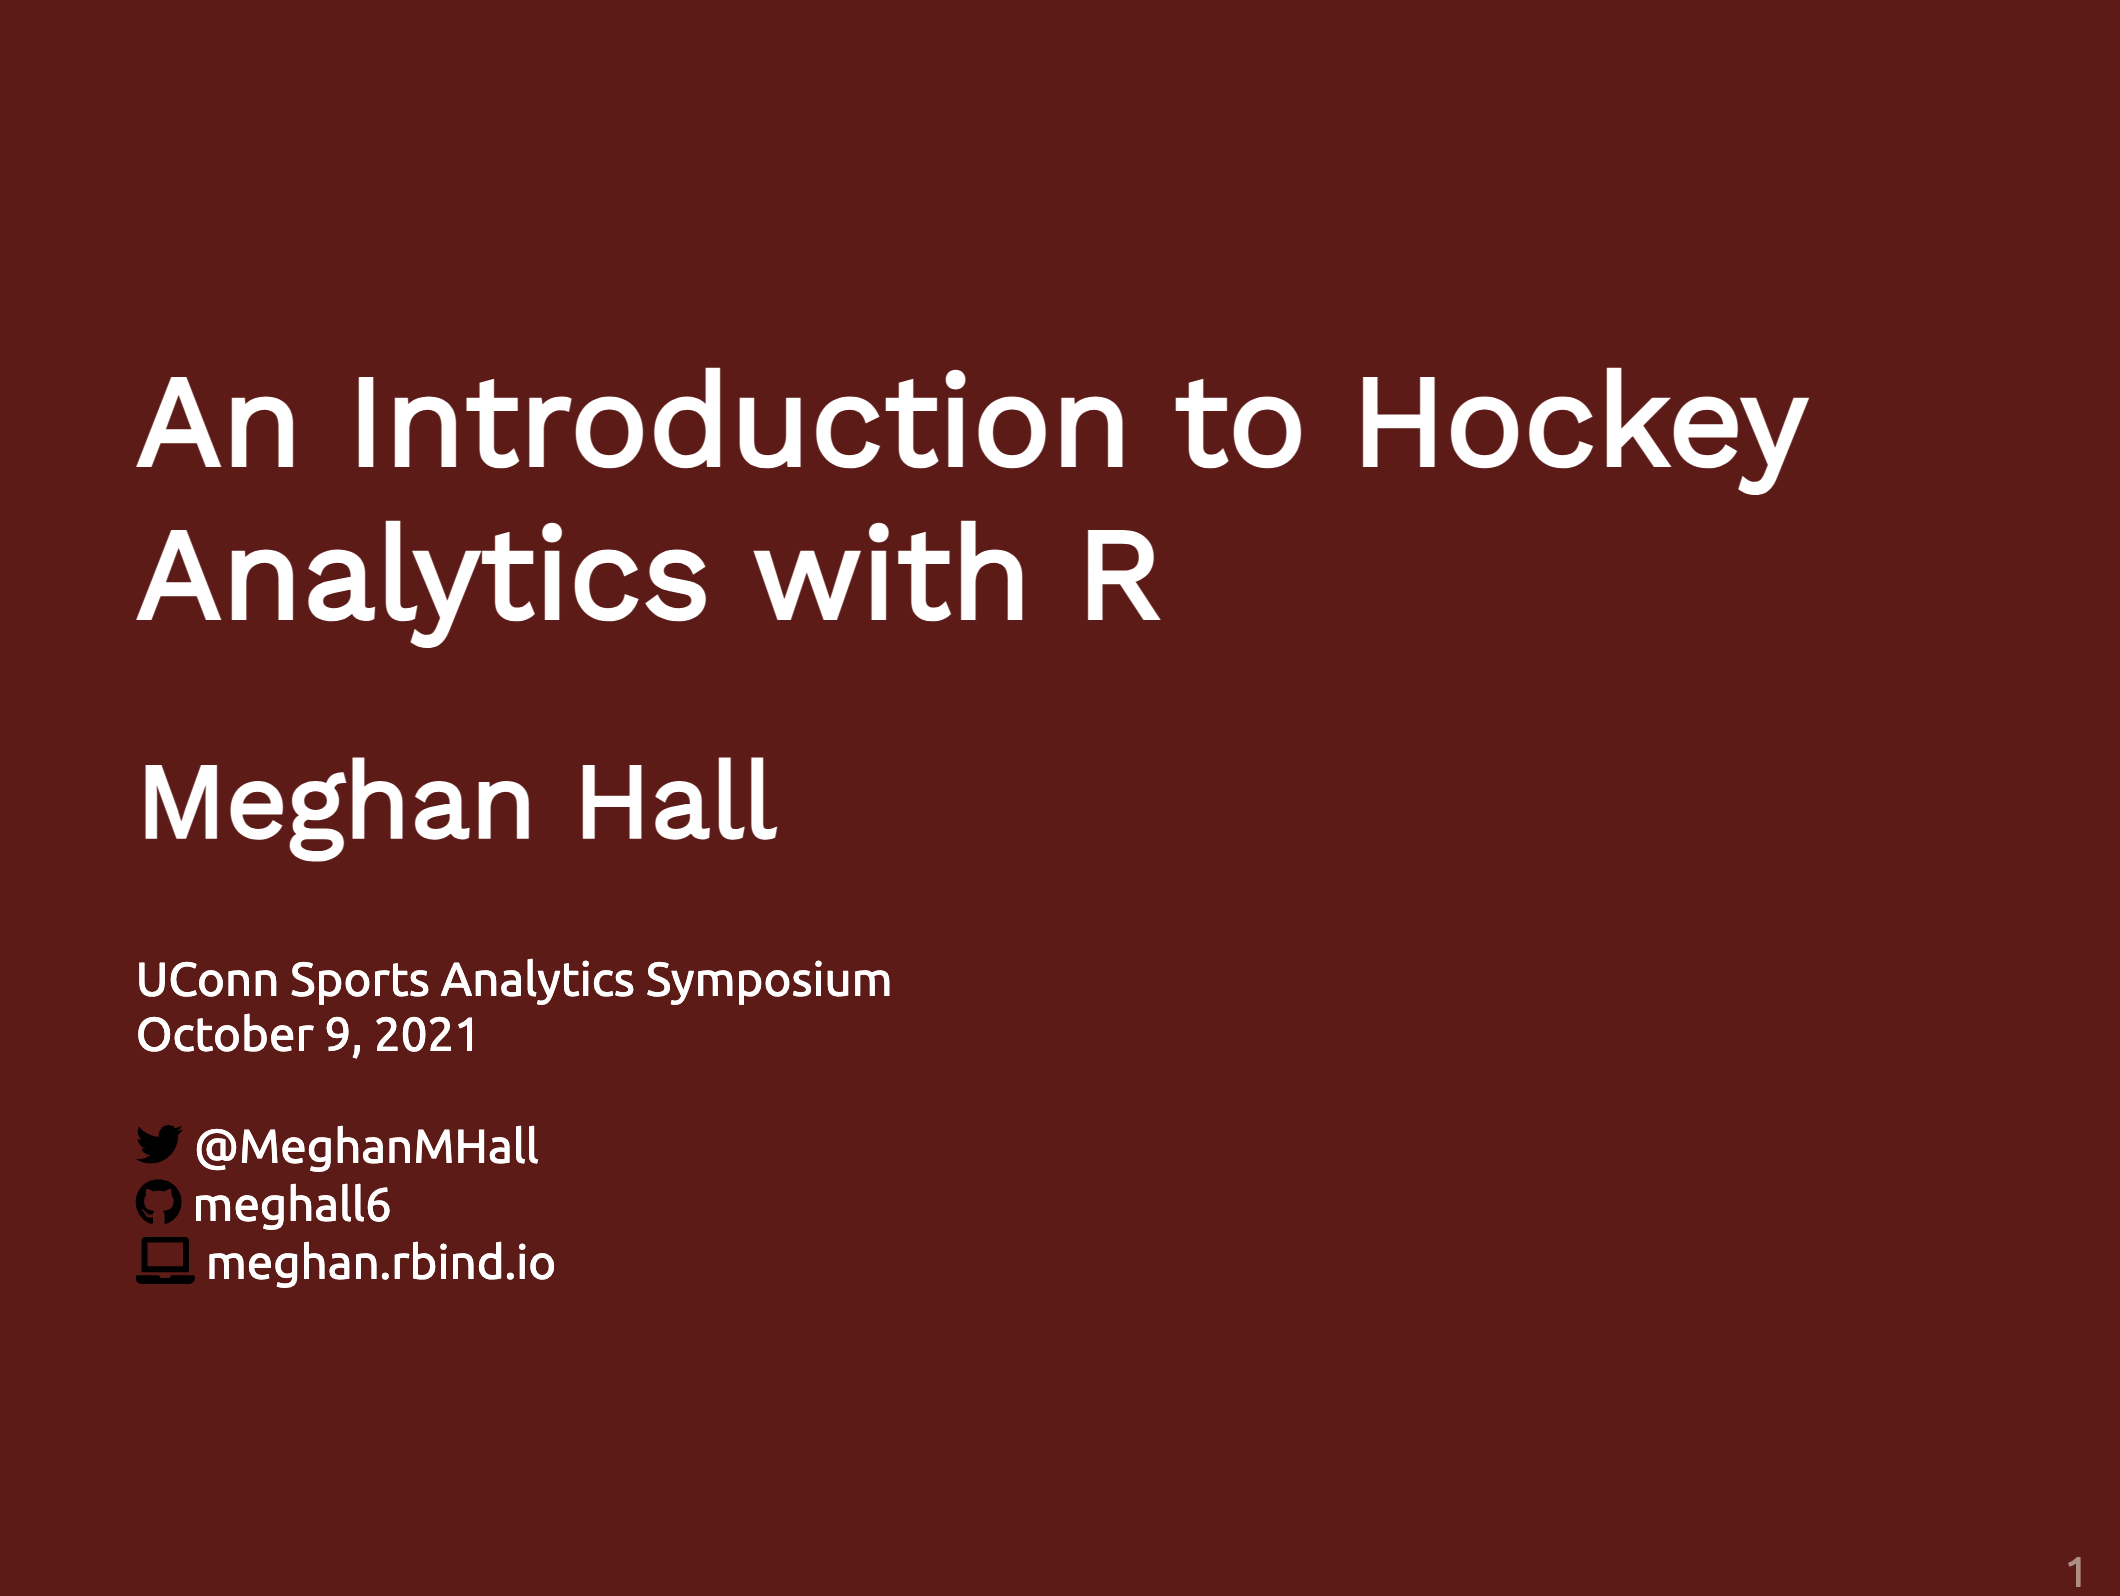
Leveling Up With The Tidyverse (And Hockey Data): Carnegie Mellon Sports Analytics Conference
learning R
tidyverse
hockey
Oct 25, 2020
Changing Global Options with Code
learning R
package
Dec 11, 2011
Understanding the Basics of Package Writing in R
package
Invalid Date
educationdata
datasets
May 29, 2025
R Markdown: The Definitive Guide
markdown
book
Joscelin’s fav
Apr 22, 2025
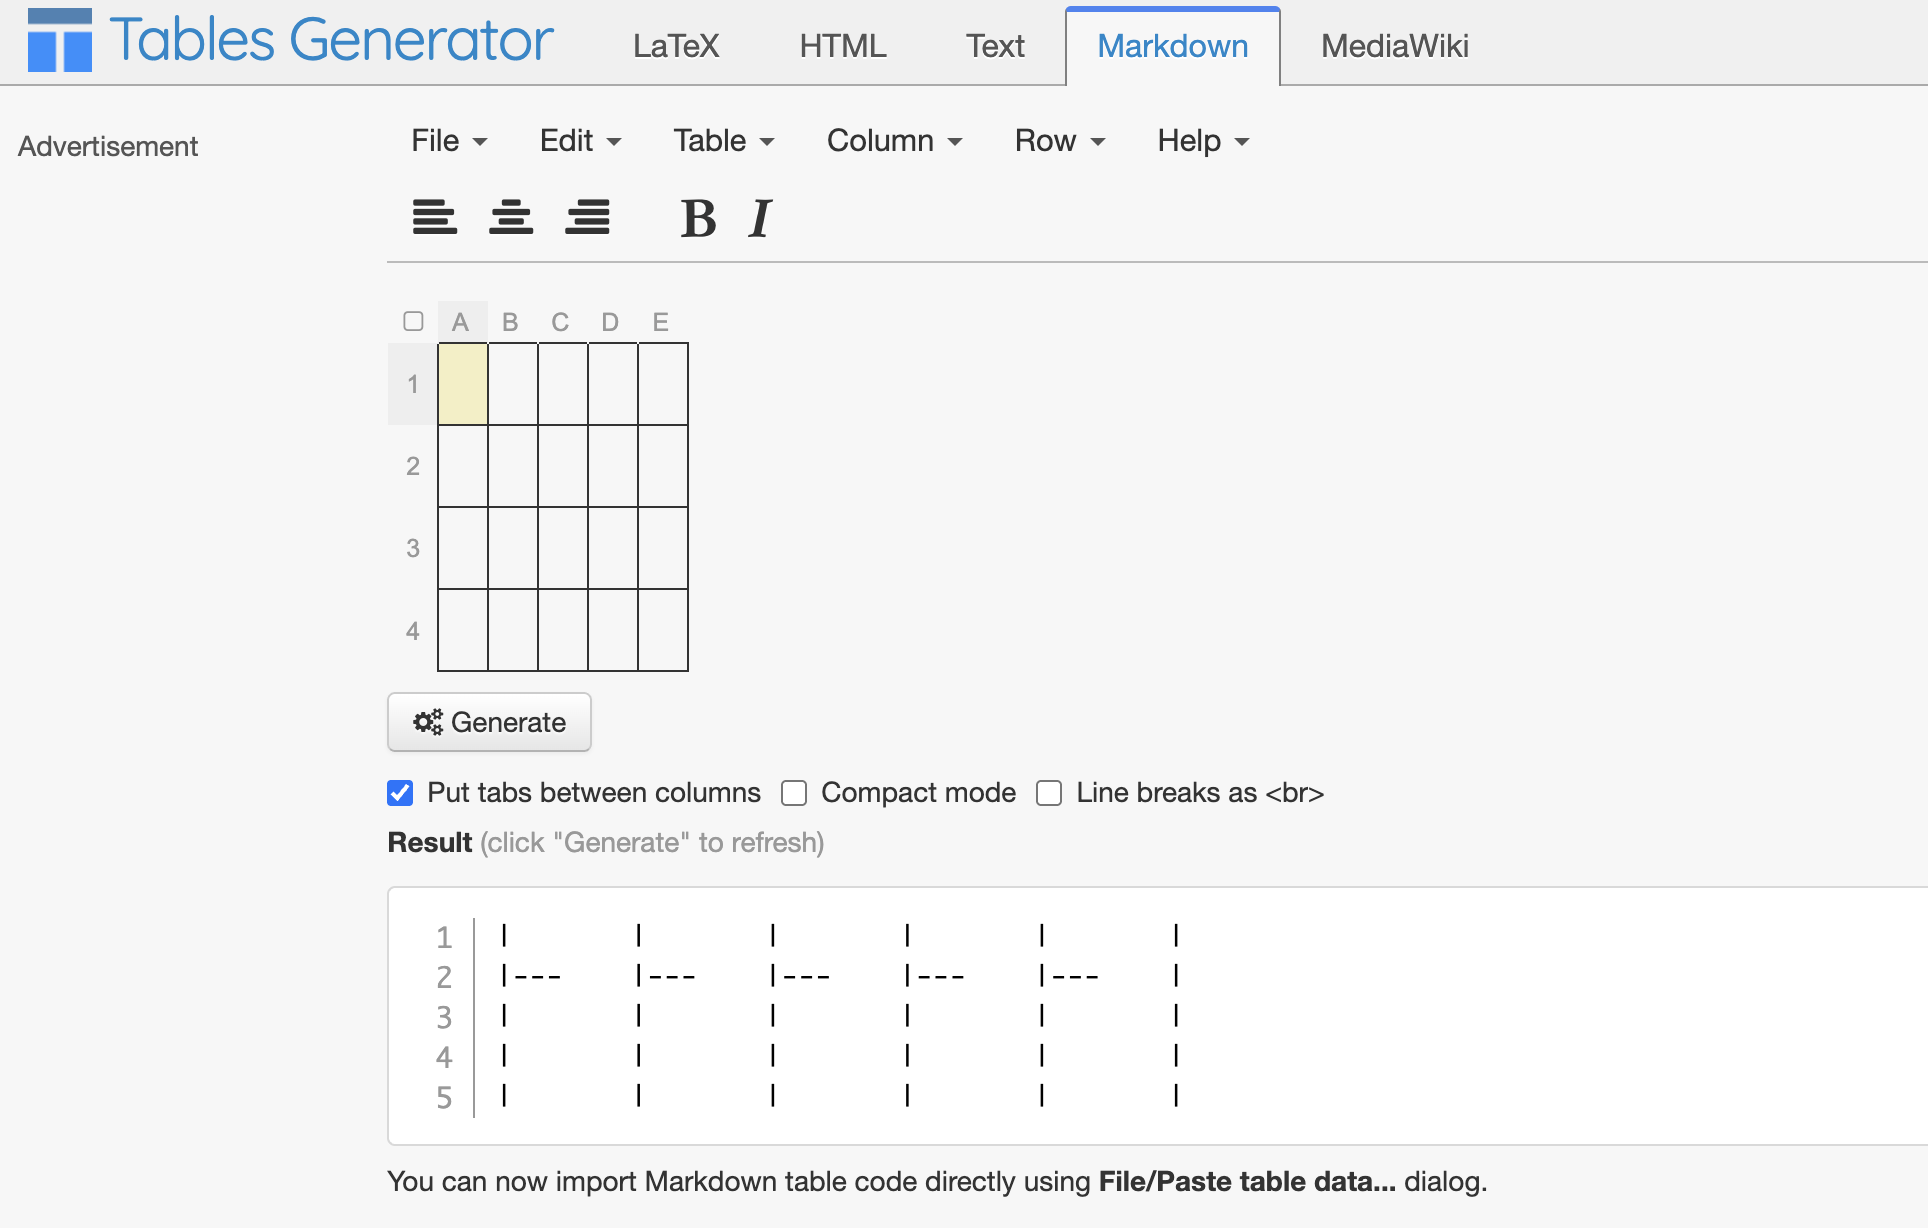
R-Markdown Table generator
markdown
Apr 22, 2025
R Markdown for Scientists
markdown
book
Apr 22, 2025
Introduction to Data Science Fall 2019
wrangling
visualization
statistics
data science
Apr 22, 2025
Advanced-Research-Methods-for-Psychologists
statistics
wrangling
visualization
intro
learning R
Apr 22, 2025
An introduction to statistics in R
statistics
intro
learning R
Apr 22, 2025
Analysis of Factorial Designs for Psychologists
statistics
Apr 22, 2025
A Practical Extension of Introductory Statistics in Psychology using R
statistics
intro
book
visualization
Apr 22, 2025
Bayesian Data Analysis course
statistics
bayesian
video
Apr 22, 2025
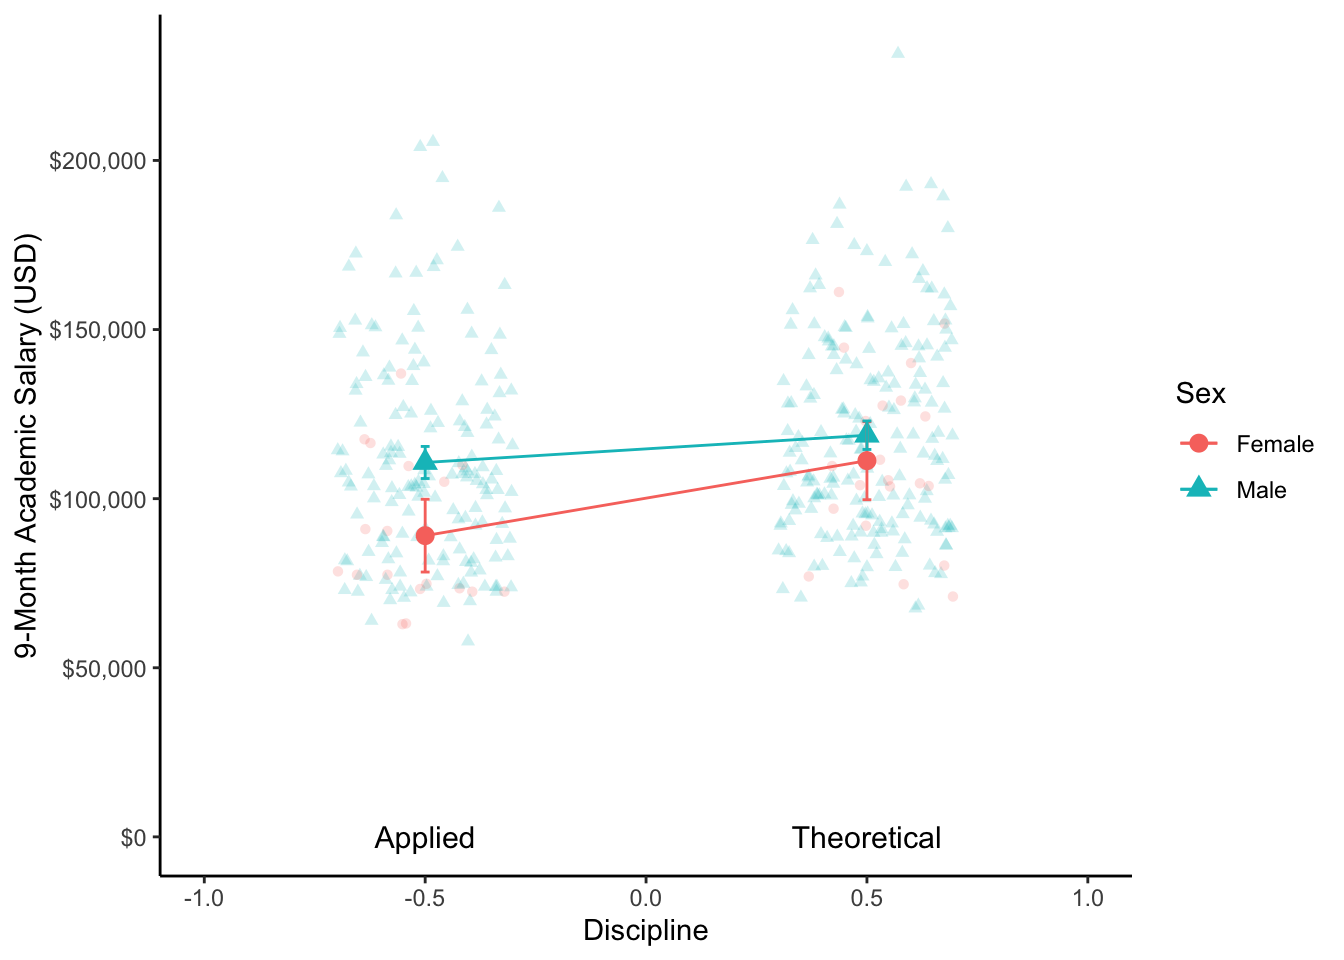
Broadening Your Statistical Horizons Generalized Linear Models and Multilevel Models
statistics
book
Apr 22, 2025
Computational Toolkit for Educational Scientists
statistics
book
visualization
Apr 22, 2025
DHARMa - Residual Diagnostics for HierARchical Models
statistics
Apr 22, 2025
Don’t Repeat Yourself in R
visualization
markdown
intro
Apr 22, 2025
GAM in R
statistics
gam
Apr 22, 2025
Mastering Spark with R
book
statistics
spark
Apr 22, 2025
Generalized Additive Models
statistics
gam
Joscelin’s fav
Apr 22, 2025
Introduction to Empirical Bayes: Examples from Baseball Statistics
statistics
bayesian
Apr 22, 2025
Learn Tidymodels
statistics
tidyverse
Apr 22, 2025
Learning Stats with Andy Wills and others:
statistics
Apr 22, 2025
Learning Statistics
statistics
intro
learning R
visualization
Apr 22, 2025
Learning Statistics with jamovi: A Tutorial for Beginners in Statistical Analysis.
statistics
intro
jamovi
Apr 22, 2025
R for data Science
data science
book
wrangling
visualization
Apr 22, 2025
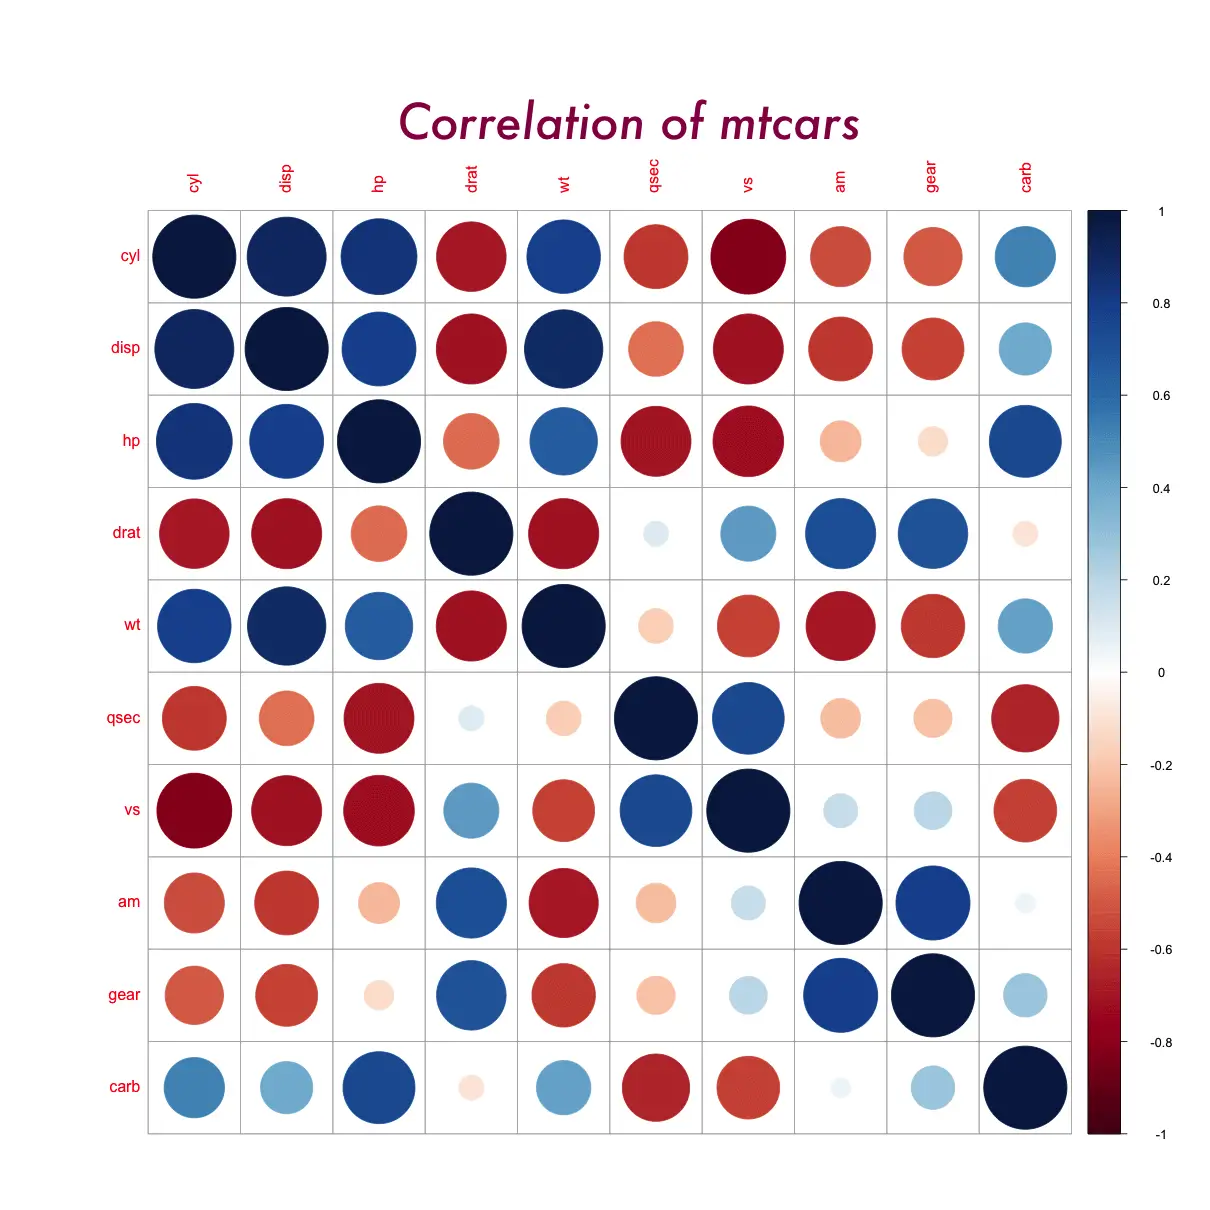
Methods and Algorithms for Correlation Analysis in R
statistics
Joscelin’s fav
Apr 22, 2025
Model Summary
statistics
Apr 22, 2025
Hello Quarto
statistics
Apr 22, 2025
PsyTeachR University of Glasgow
teaching r
statistics
visualization
data science
package creation
teaching r
learning r
Apr 22, 2025
R course
statistics
course
video
Apr 22, 2025
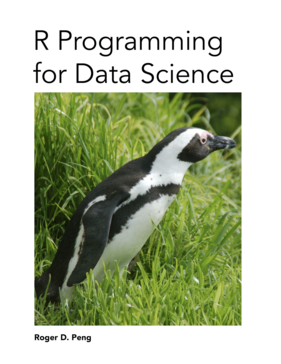
R Programming for Data Science
data science
wrangling
book
Apr 22, 2025
r-statistics.co
statistics
Apr 22, 2025
report Package
statistics
package
Apr 22, 2025
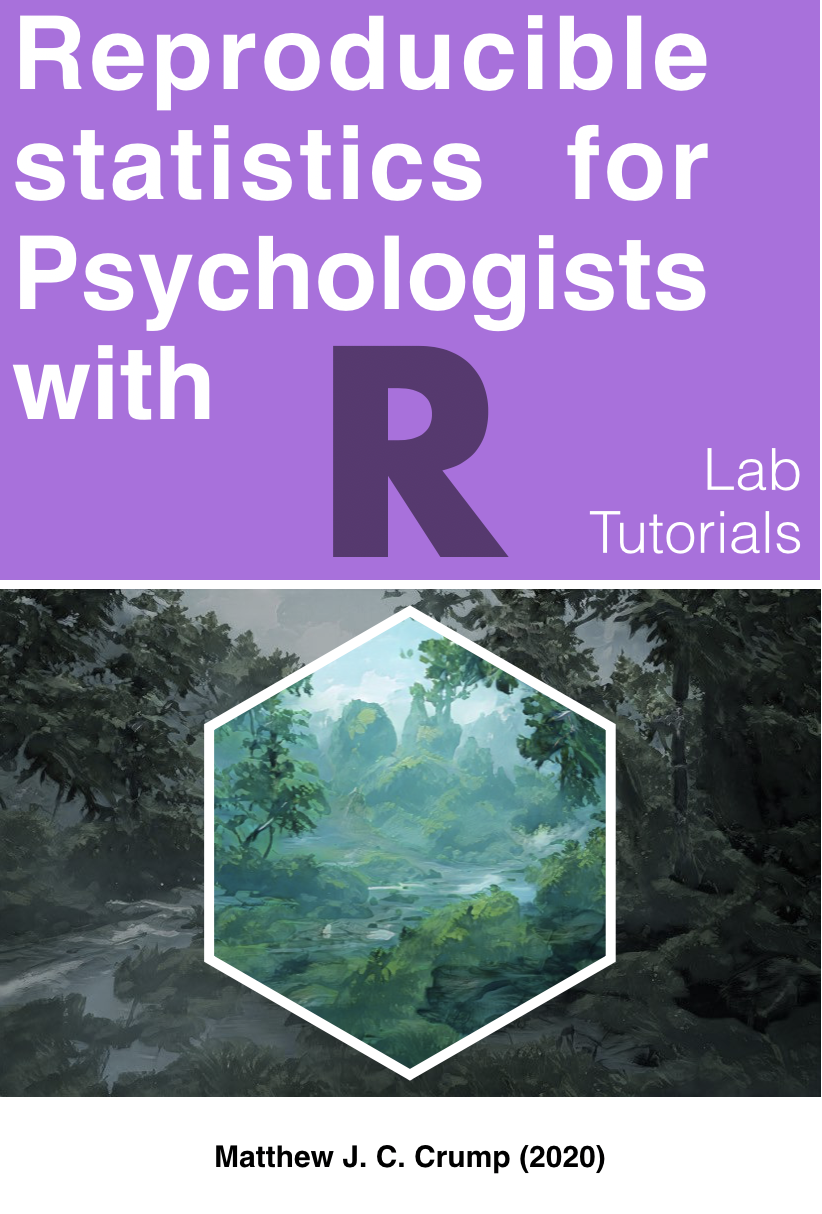
Reproducible Statistics for Psychologists with R-Lab Tutorials
statistics
book
Apr 22, 2025
Statistical Thinking for the 21st Century
statistics
python
Apr 22, 2025
STAT 545 Data wrangling, exploration, and analysis with R
statistics
Apr 22, 2025
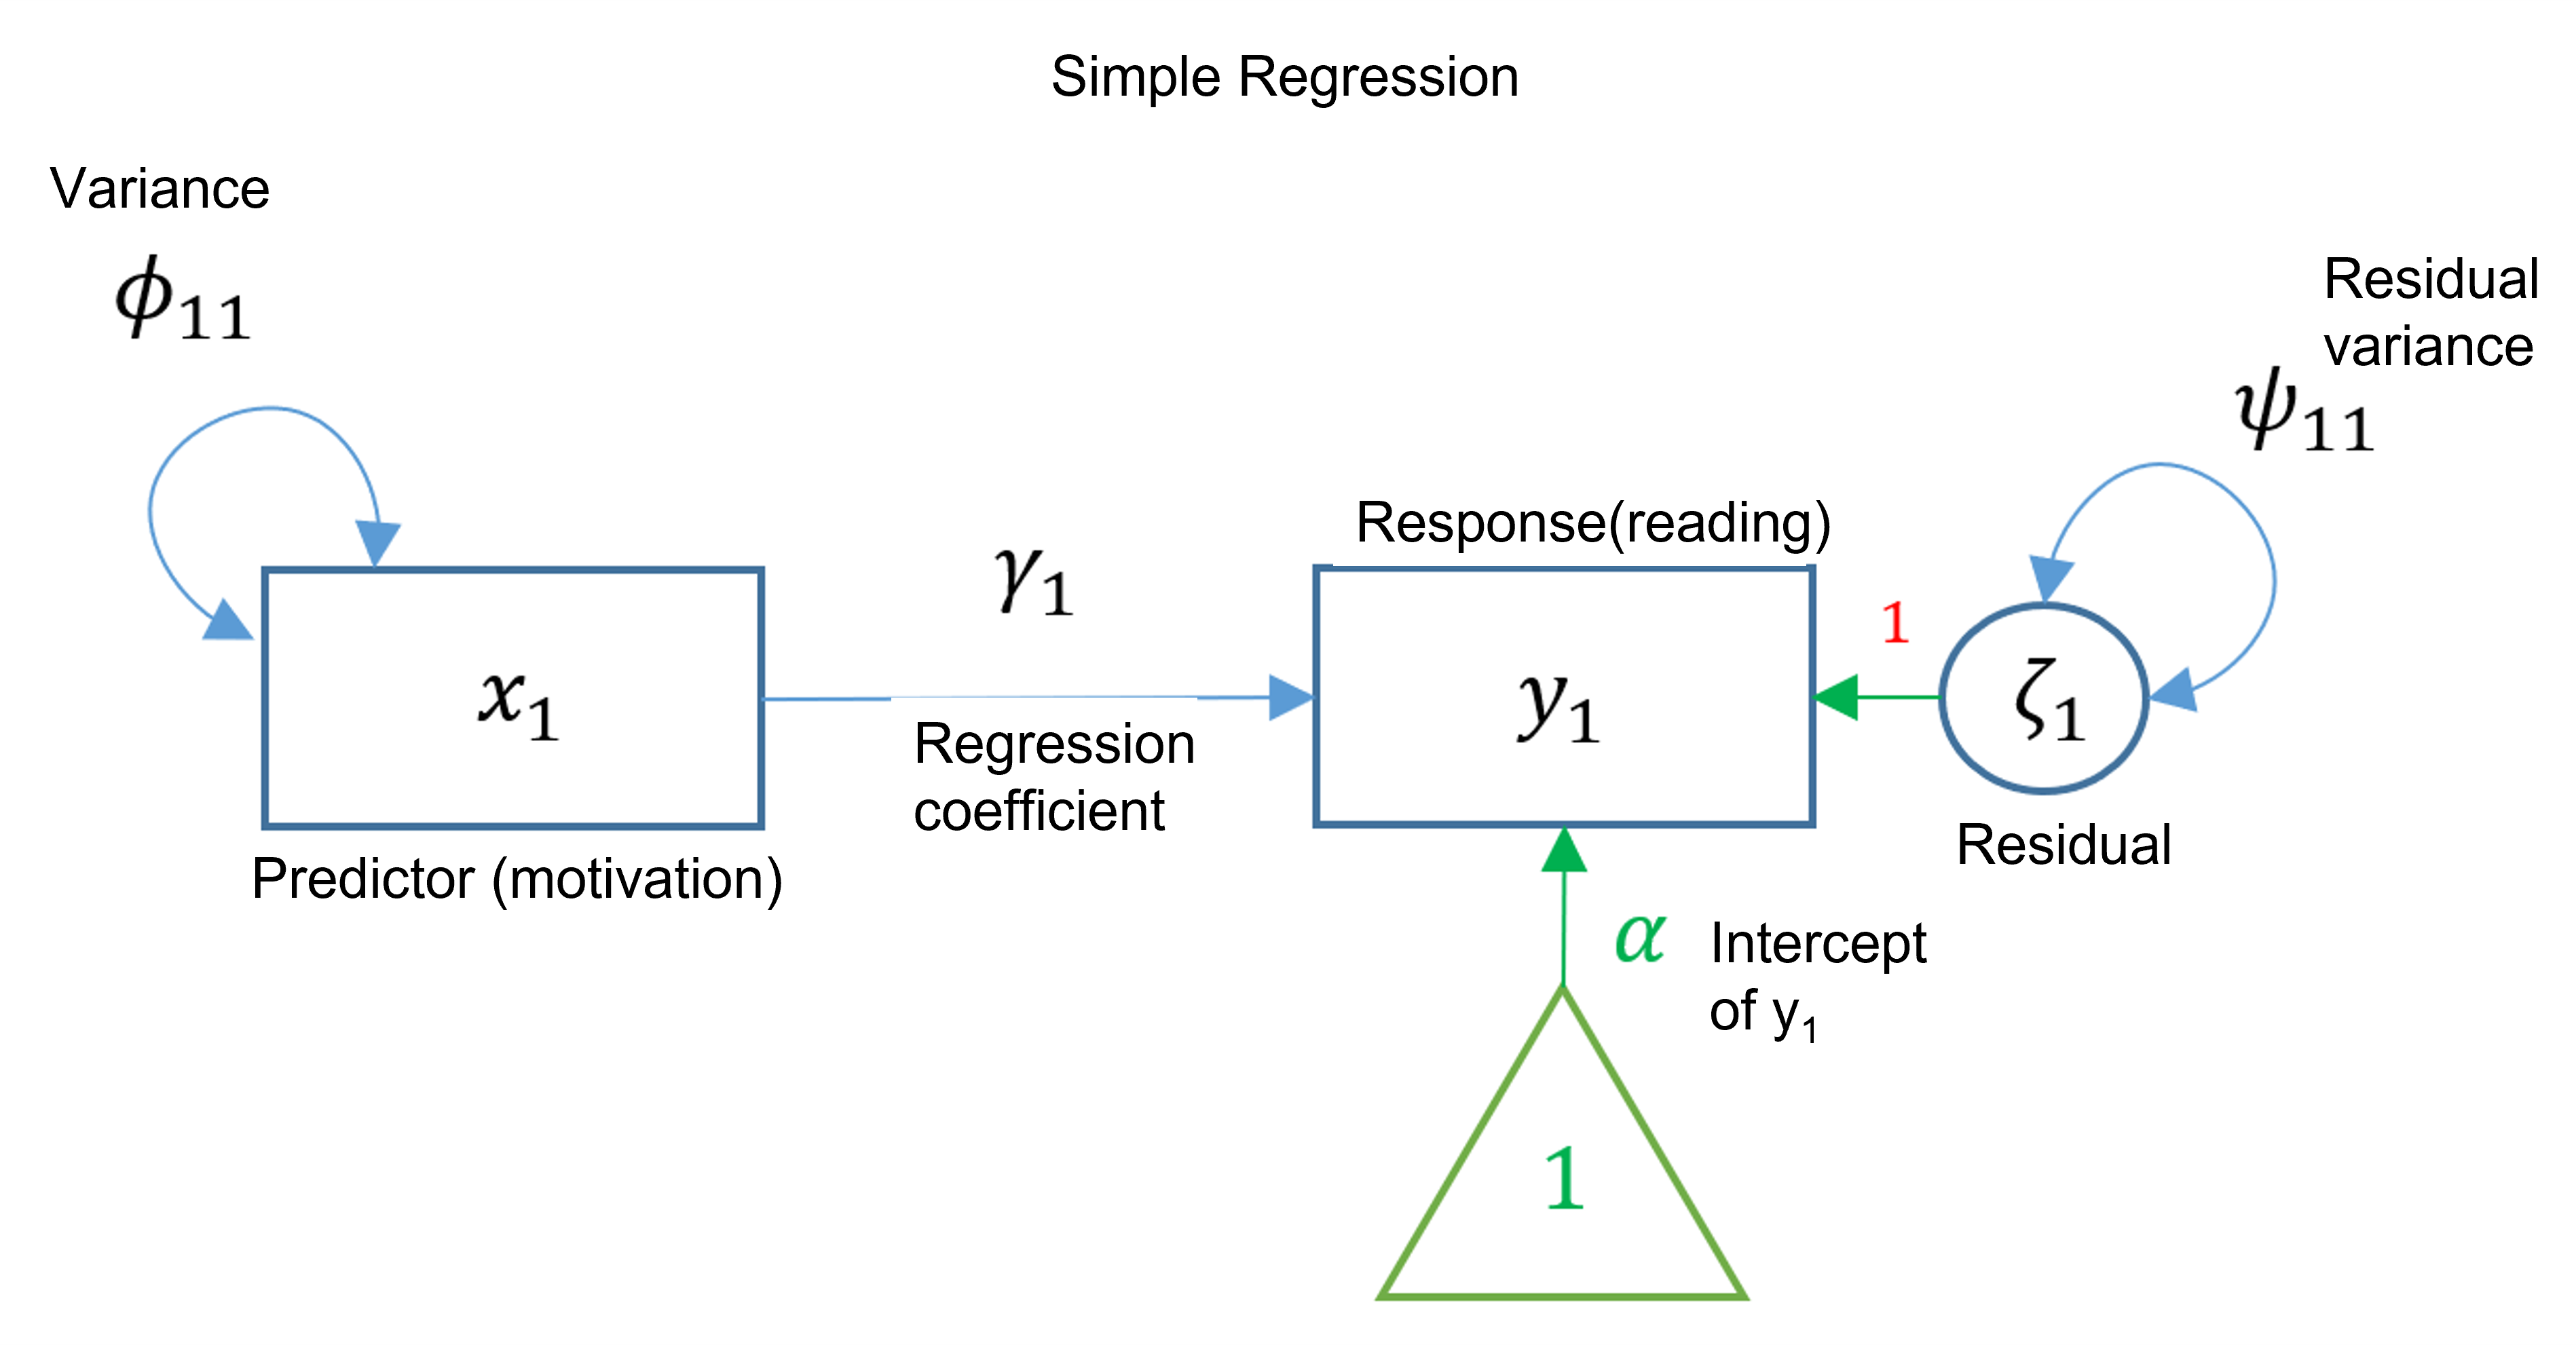
Structural Equation Modeling (SEM) in R
statistics
Joscelin’s fav
sem
Apr 22, 2025
powerLATE
statistics
package
Apr 22, 2025
Data Science in a Box
teaching r
data science
Apr 22, 2025
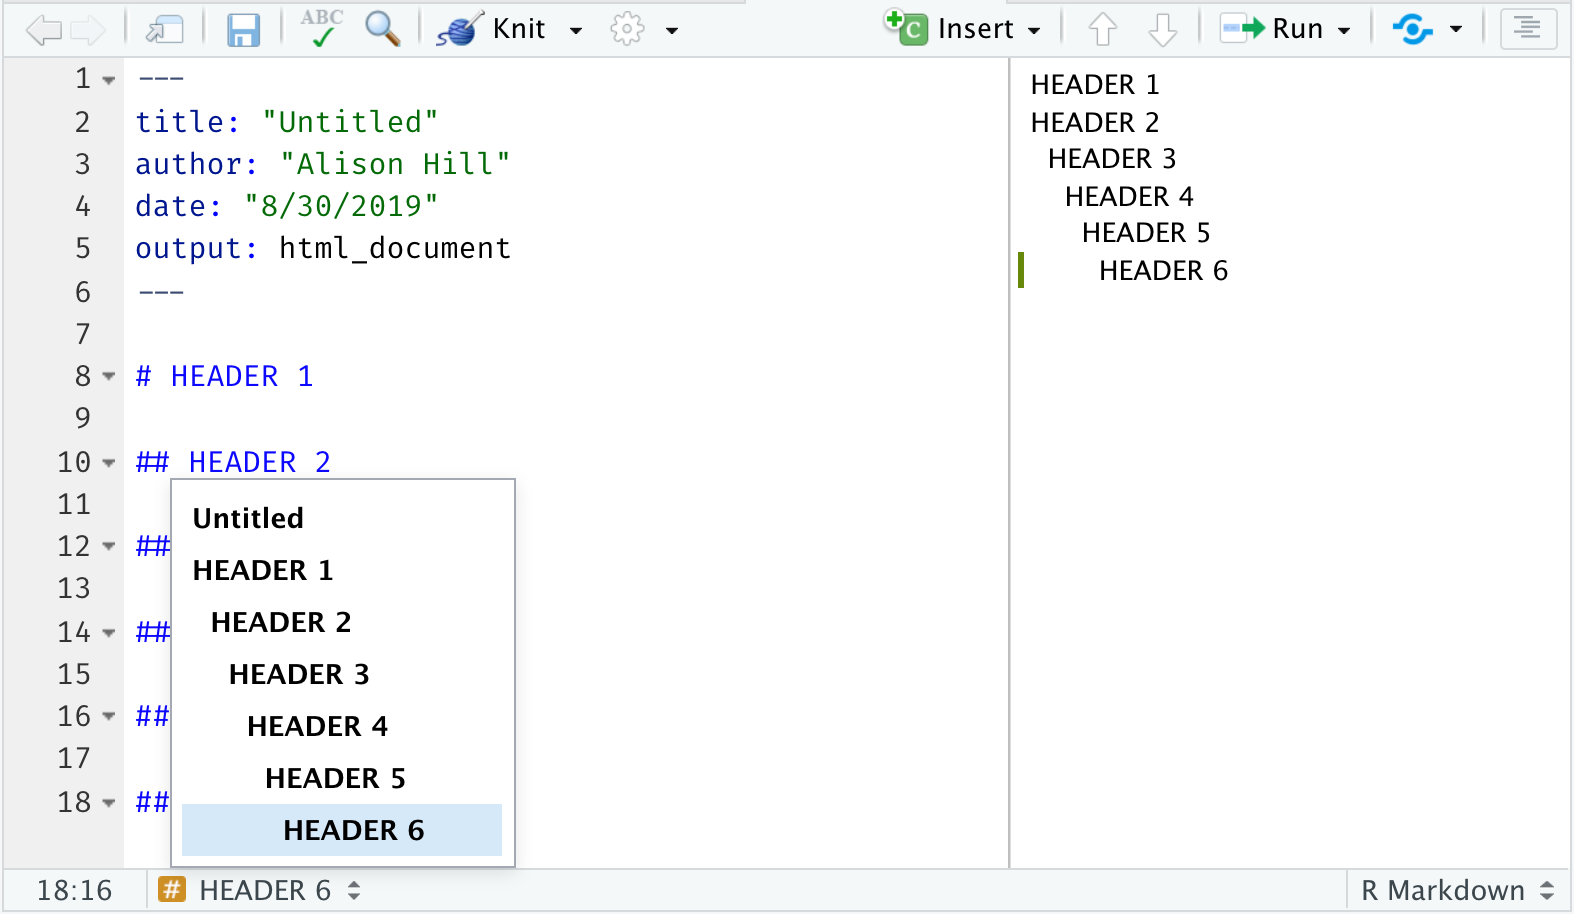
How I Teach R Markdown
teaching r
blog
Apr 22, 2025
A Gentle Guide to the Grammar of Graphics with ggplot2
visualization
Joscelin’s fav
slides
Apr 22, 2025
An Introduction to Hierarchical Modeling
visualization
Joscelin’s fav
Apr 22, 2025
Hello Quarto
visualization
Apr 22, 2025
Basic usage of tidycensus-a vignette
visualization
package
Apr 22, 2025
colorblindr
visualization
Joscelin’s fav
package
Apr 22, 2025
Text Mining with R A Tidy Approach
visualization
statistics
book
Apr 22, 2025
Crime Mapping in R
visualization
geospatial
statistics
book
Apr 22, 2025
Hello Quarto
visualization
Apr 22, 2025
Hello Quarto
visualization
Apr 22, 2025
Hello Quarto
visualization
Apr 22, 2025
Hello Quarto
visualization
Apr 22, 2025
Hello Quarto
visualization
Apr 22, 2025
Hello Quarto
visualization
Apr 22, 2025
Hello Quarto
visualization
Apr 22, 2025
Hello Quarto
visualization
Apr 22, 2025
Hello Quarto
visualization
Apr 22, 2025
Hello Quarto
visualization
Apr 22, 2025
Hello Quarto
visualization
Apr 22, 2025
Hello Quarto
visualization
Apr 22, 2025
Hello Quarto
visualization
Apr 22, 2025
Hello Quarto
visualization
Apr 22, 2025
Hello Quarto
visualization
Apr 22, 2025
Hello Quarto
visualization
Apr 22, 2025
Hello Quarto
visualization
Apr 22, 2025
Hello Quarto
visualization
Apr 22, 2025
Hello Quarto
visualization
Apr 22, 2025
Hello Quarto
visualization
Apr 22, 2025
Hello Quarto
visualization
Apr 22, 2025
Hello Quarto
visualization
Apr 22, 2025
Hello Quarto
visualization
Apr 22, 2025
Hello Quarto
visualization
Apr 22, 2025
Hello Quarto
visualization
Apr 22, 2025
Hello Quarto
visualization
Apr 22, 2025
Hello Quarto
visualization
Apr 22, 2025
Hello Quarto
visualization
Apr 22, 2025
Hello Quarto
visualization
Apr 22, 2025
Hello Quarto
visualization
Apr 22, 2025
Hello Quarto
visualization
Apr 22, 2025
Hello Quarto
visualization
Apr 22, 2025
Hello Quarto
visualization
Apr 22, 2025
Hello Quarto
visualization
Apr 22, 2025
Hello Quarto
visualization
Apr 22, 2025
Hello Quarto
visualization
Apr 22, 2025
Hello Quarto
visualization
Apr 22, 2025
Hello Quarto
visualization
Apr 22, 2025
Hello Quarto
visualization
Apr 22, 2025
Hello Quarto
visualization
Apr 22, 2025
Hello Quarto
visualization
Apr 22, 2025
Hello Quarto
visualization
Apr 22, 2025
Hello Quarto
visualization
Apr 22, 2025
Hello Quarto
visualization
Apr 22, 2025
Hello Quarto
visualization
Apr 22, 2025
Hello Quarto
visualization
Apr 22, 2025
Hello Quarto
visualization
Apr 22, 2025
Hello Quarto
visualization
Apr 22, 2025
Hello Quarto
visualization
Apr 22, 2025
Hello Quarto
visualization
Apr 22, 2025
Hello Quarto
visualization
Apr 22, 2025
Hello Quarto
visualization
Apr 22, 2025
Hello Quarto
visualization
Apr 22, 2025
Hello Quarto
visualization
Apr 22, 2025
Hello Quarto
visualization
Apr 22, 2025
Hello Quarto
visualization
Apr 22, 2025
Hello Quarto
visualization
Apr 22, 2025
Hello Quarto
visualization
Apr 22, 2025
Hello Quarto
visualization
Apr 22, 2025
Hello Quarto
visualization
Apr 22, 2025
Hello Quarto
visualization
Apr 22, 2025
Hello Quarto
visualization
Apr 22, 2025
Hello Quarto
visualization
Apr 22, 2025
Hello Quarto
visualization
Apr 22, 2025
Hello Quarto
visualization
Apr 22, 2025
Hello Quarto
visualization
Apr 22, 2025
Hello Quarto
visualization
Apr 22, 2025
Hello Quarto
visualization
Apr 22, 2025
Hello Quarto
visualization
Apr 22, 2025
Hello Quarto
visualization
Apr 22, 2025
Hello Quarto
visualization
Apr 22, 2025
Hello Quarto
visualization
Apr 22, 2025
Hello Quarto
workflows
Apr 22, 2025
Hello Quarto
workflows
Apr 22, 2025
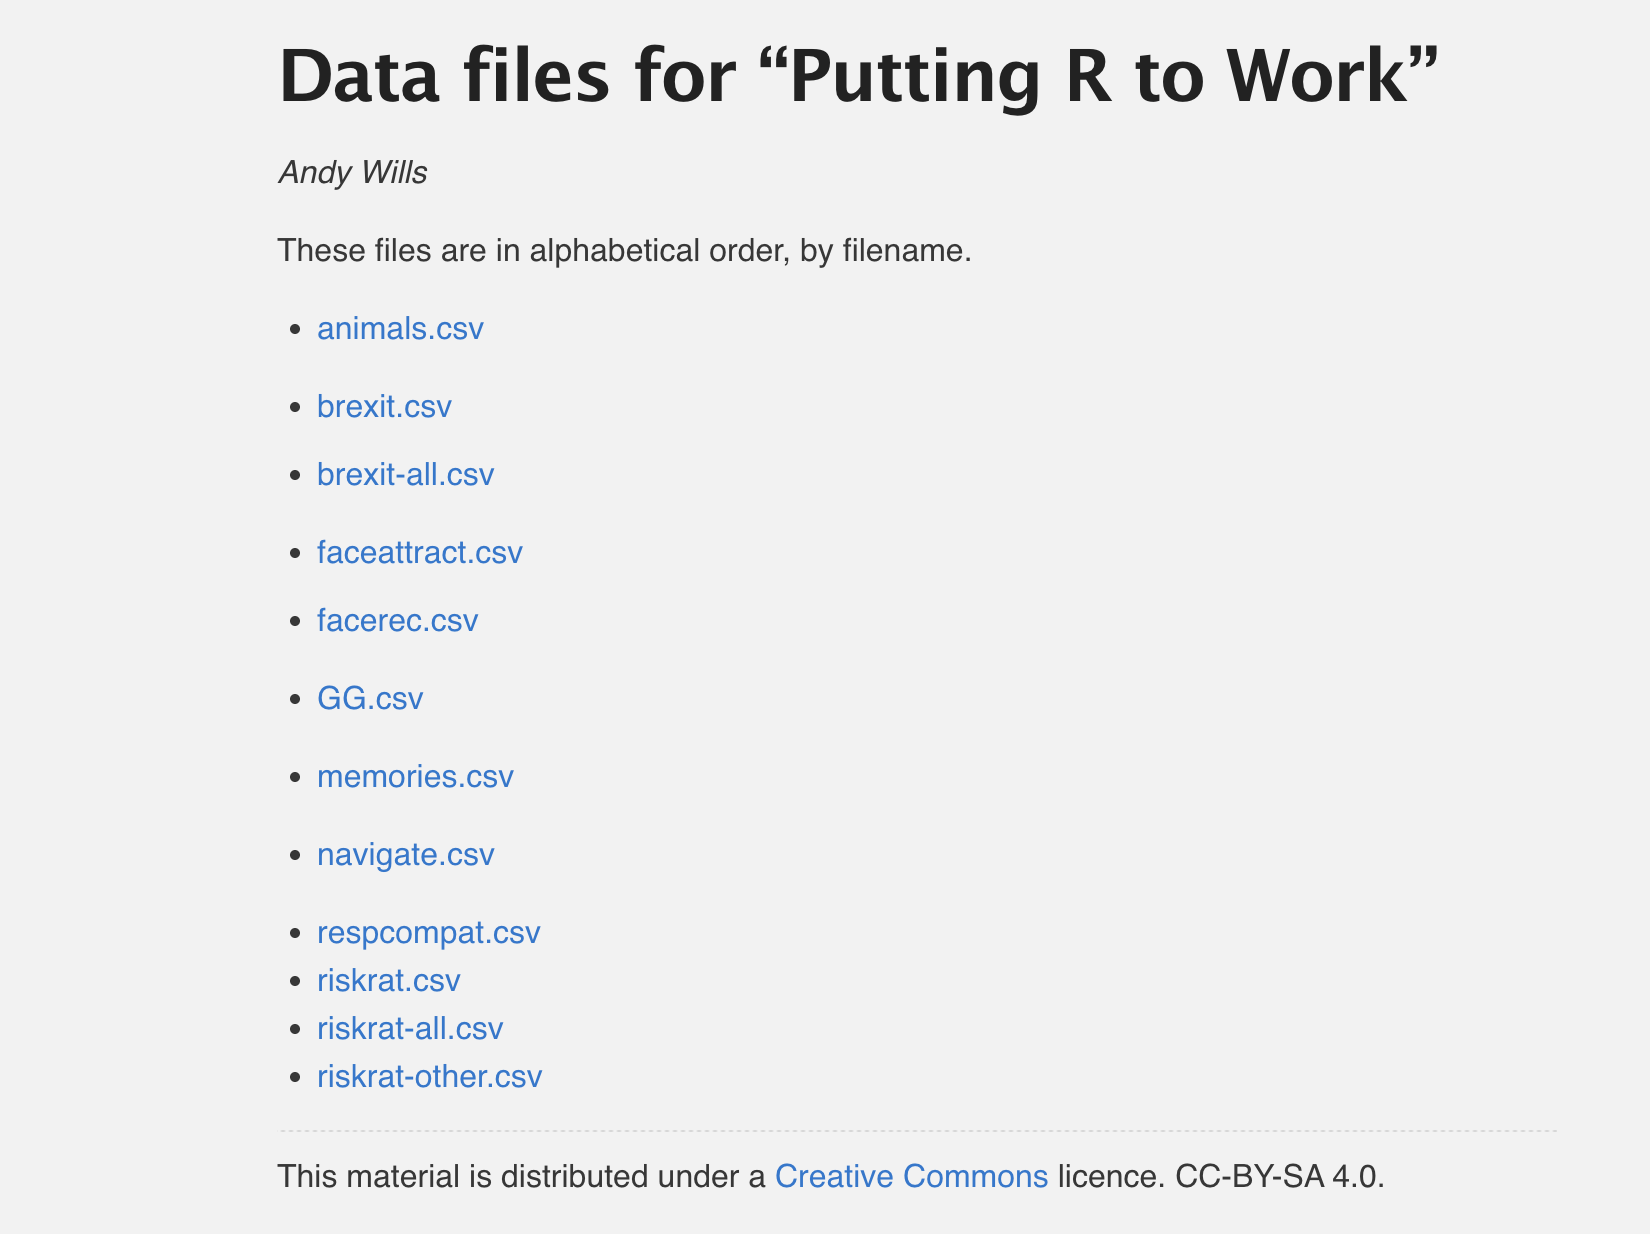
Data files for ‘Putting R to Work’
datasets
Apr 22, 2025
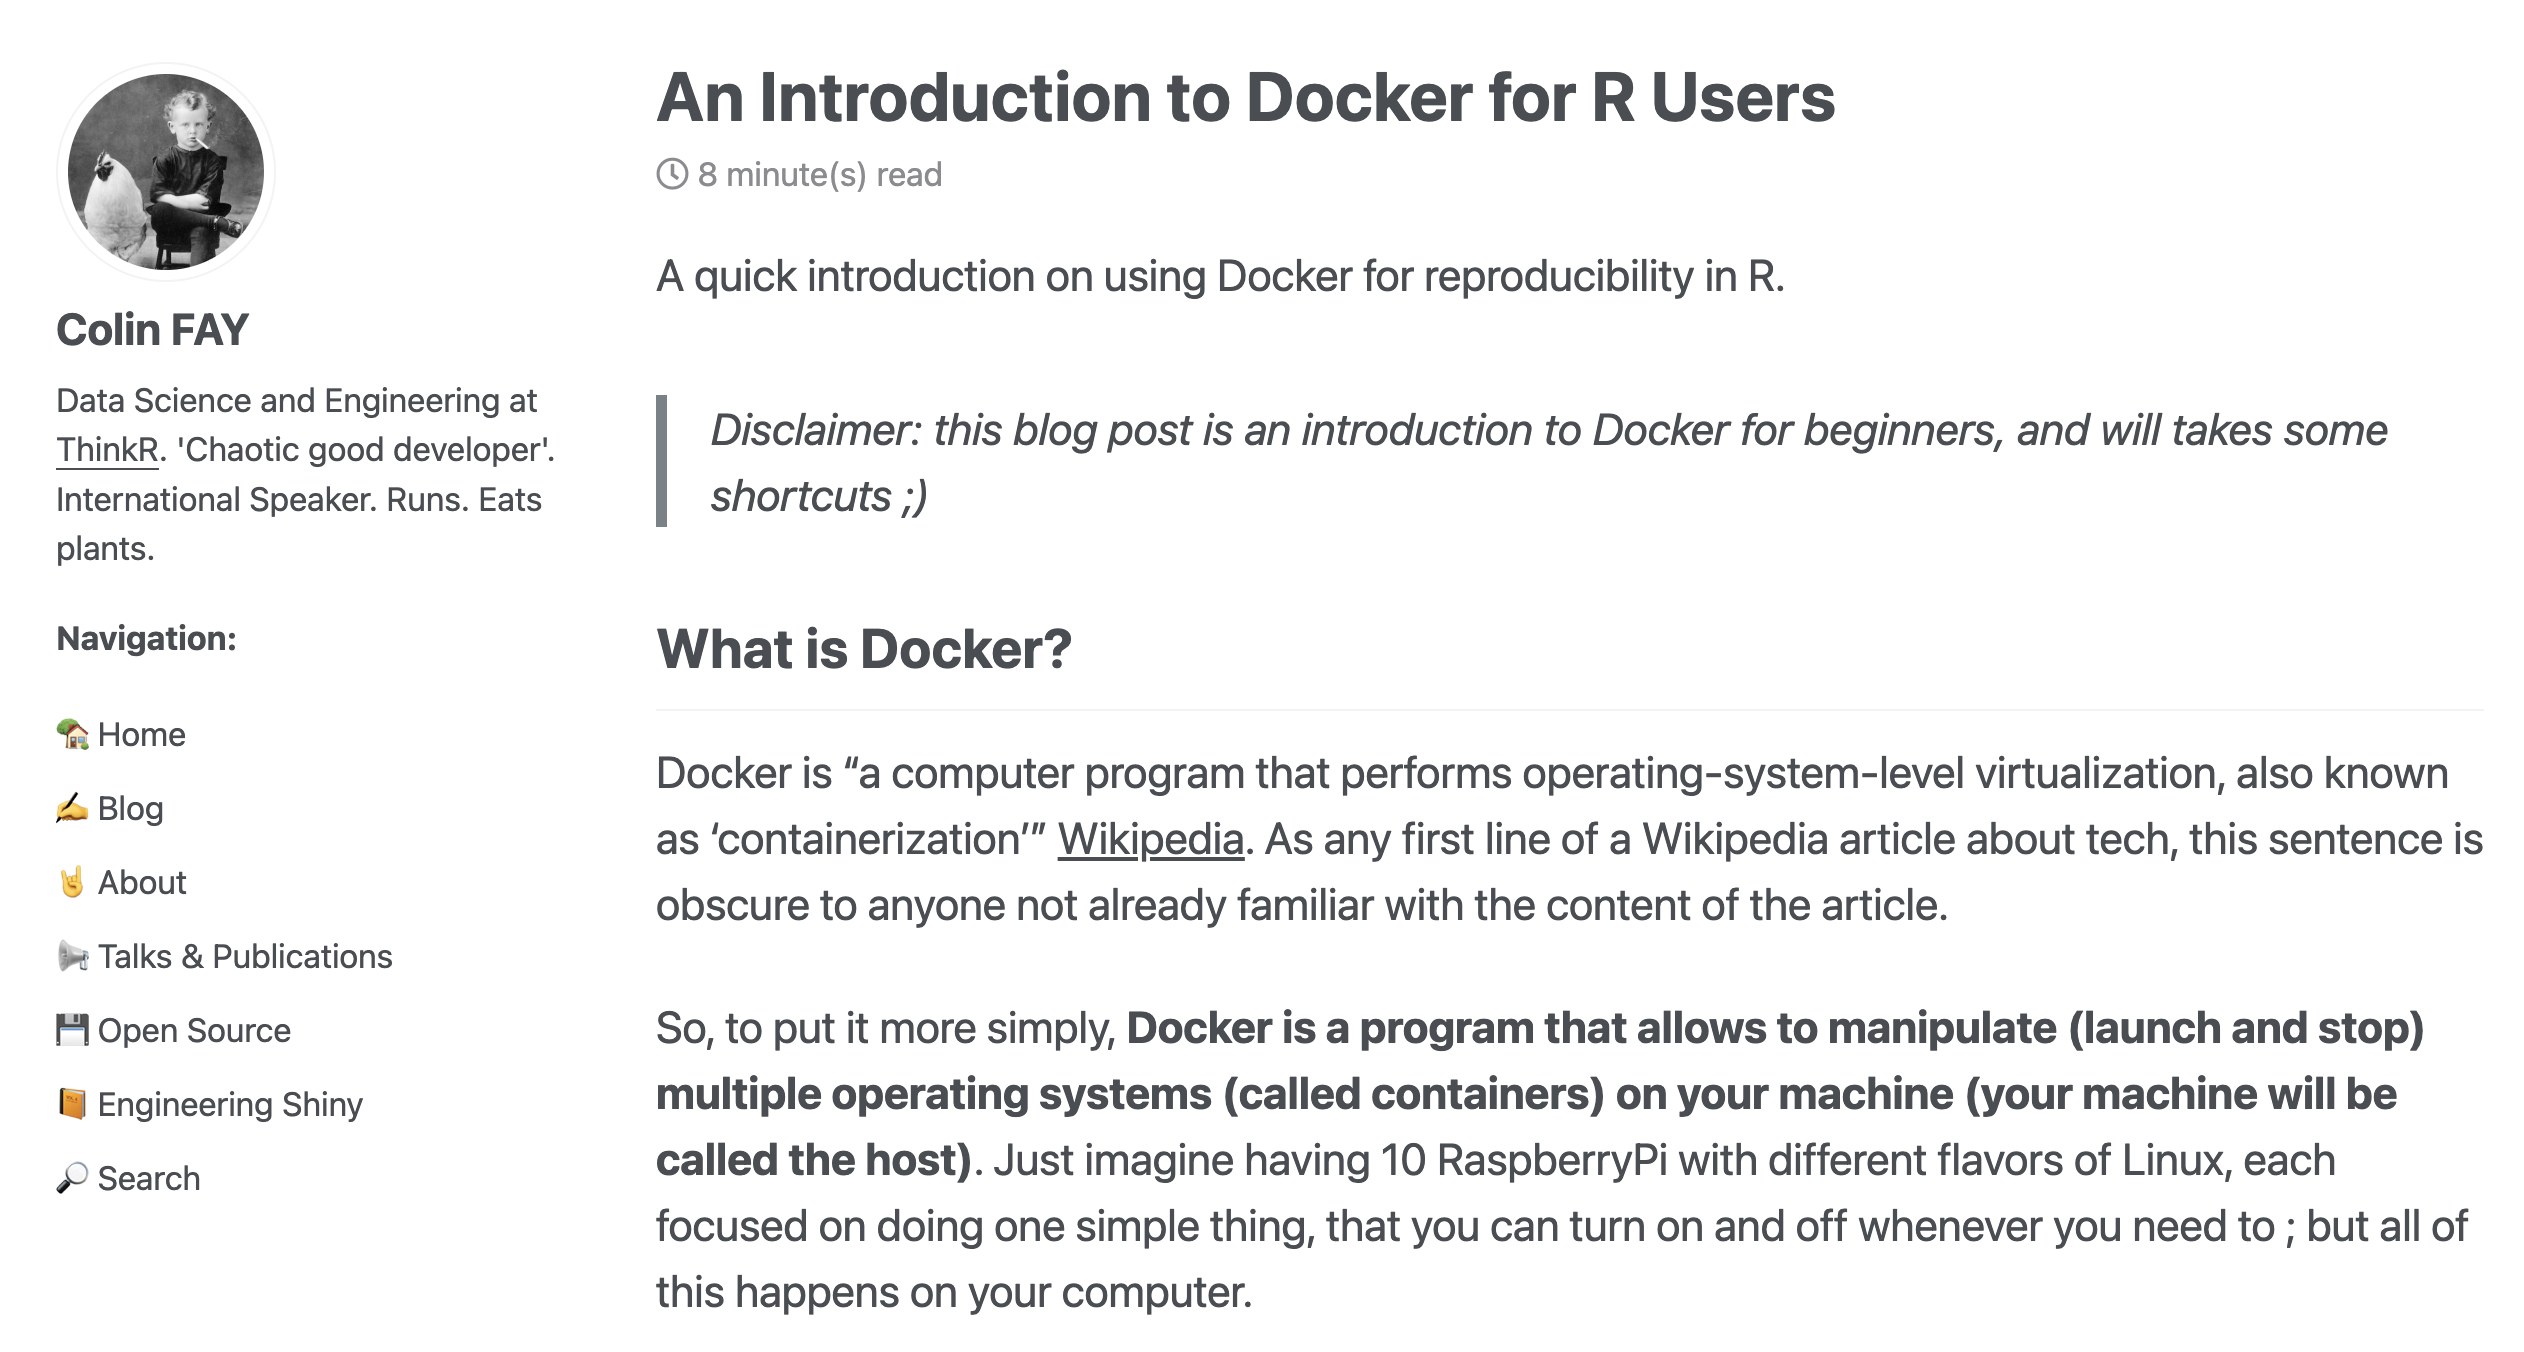
An Introduction to Docker for R Users
docker
Apr 22, 2025
aoianalysis
eye tracking
statistics
Apr 22, 2025
Adding a Sound when script is done (option 1)
Apr 22, 2025
A Jupyter + R ( + mybinder.org) tutorial for social scientists
statistics
jupyter
Apr 22, 2025
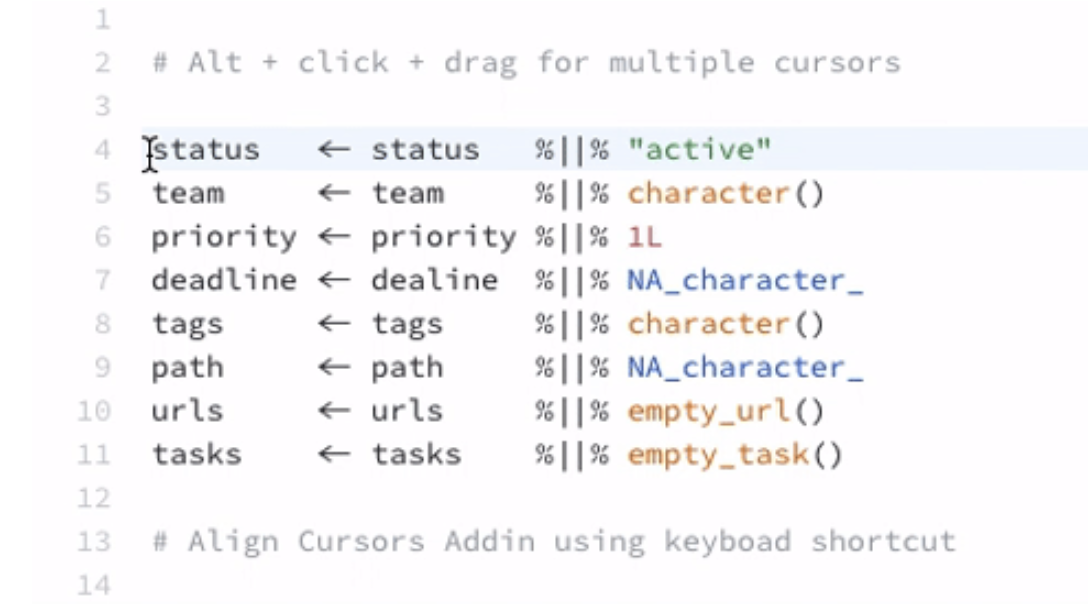
AlignAssign
tricks
Apr 22, 2025
forcatspart of the tidyverse
tidyverse
factors
Apr 22, 2025
Happy Git and GitHub for the useR
git
github
book
Apr 22, 2025
Tidy animated verbs
tidyverse
tricks
Apr 22, 2025
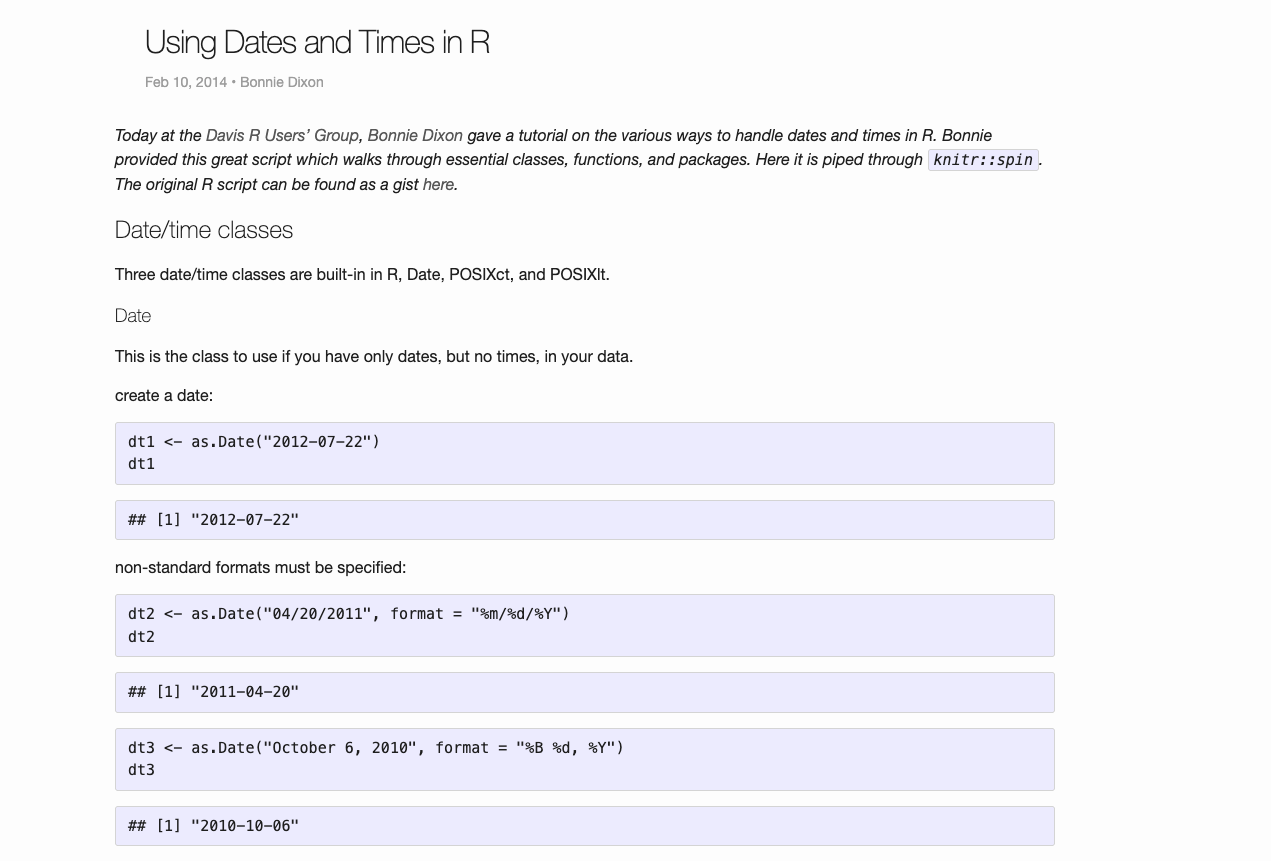
Using Dates and Times in R
dates
tutorial
Apr 22, 2025
Videos by Sharon Machlis for fun things
video
email
plugin
python
slack
text message
Apr 22, 2025
30DayChartChallenge: Steven Ponce’s Contributions
visualization
Apr 17, 2025
An Introduction to the {gganimate} Package
visualization
Apr 17, 2025
Best Practices for Data Visualisation
visualization
Joscelin’s fav
Apr 17, 2025
Conversion Research Methods 1 and 2 courses at the University of Glasgow School of Psychology & Neuroscience
statistics
visualization
intro
learning R
book
Mar 27, 2025
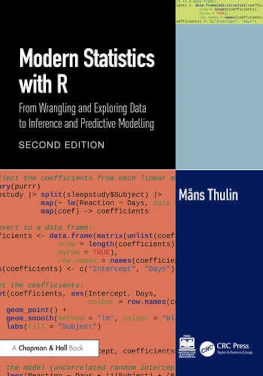
Modern Statistics with R: From wrangling and exploring data to inference and predictive modelling
statistics
Mar 18, 2025
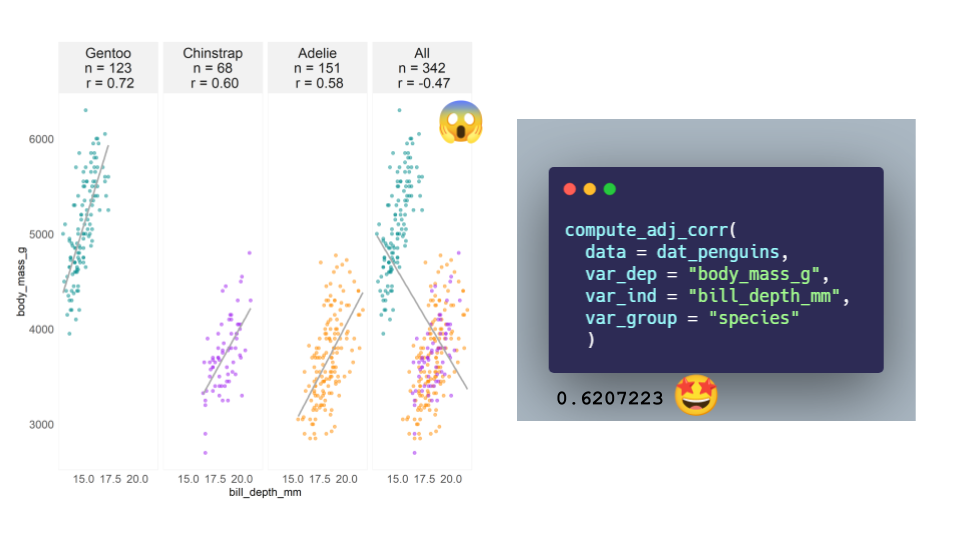
Estimating Correlations Adjusted for Group Membership
statistics
Feb 22, 2025
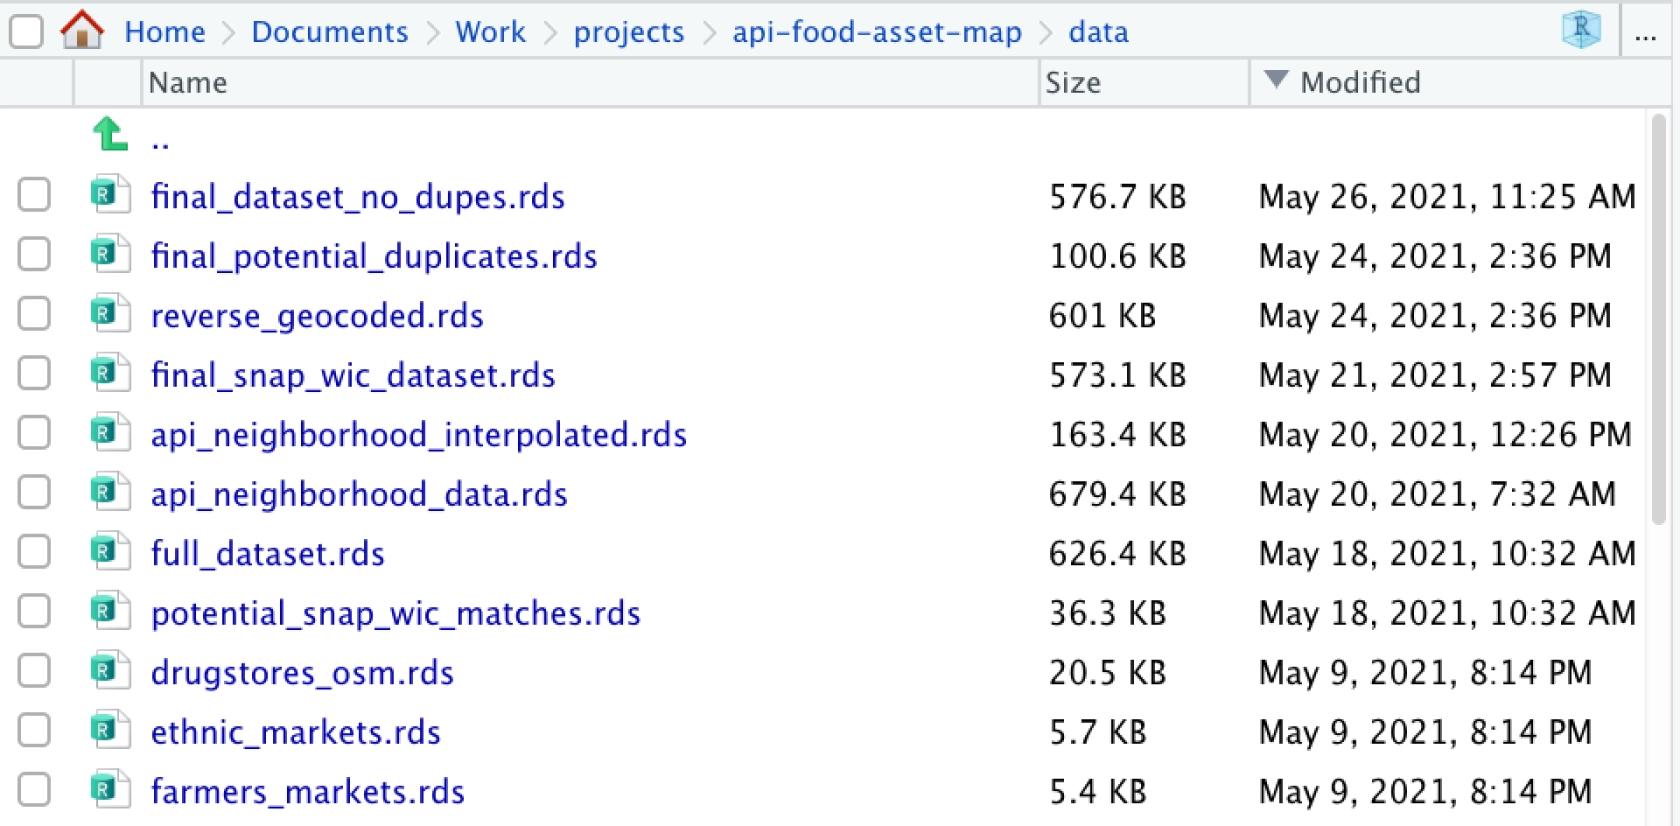
How I Structure My RStudio Projects
data science
organization
Feb 20, 2025
Using Word Reference Documents with RMarkdown to Create Custom Reports
markdown
video
Feb 20, 2025
How to Name Files
filenames
data science
talk
organization
video
Feb 20, 2025
Reproducible Data Science in R: Iterate, Don’t Duplicate
blog
data science
Feb 20, 2025
Reproducible Data Science in R: Flexible Functions Using Tidy Evaluation
blog
data science
wrangling
Feb 20, 2025
Reproducible Data Science in R: Writing Better Functions
talk
data science
Feb 20, 2025
Adding Sparklines to gt Tables
visualization
Feb 20, 2025
Dark ggtheme: Publication-Ready Themes and Color Palettes for ggplot2
visualization
package
Feb 20, 2025
crimedatasets: A Comprehensive Collection of Crime-Related Datasets
datasets
Feb 20, 2025
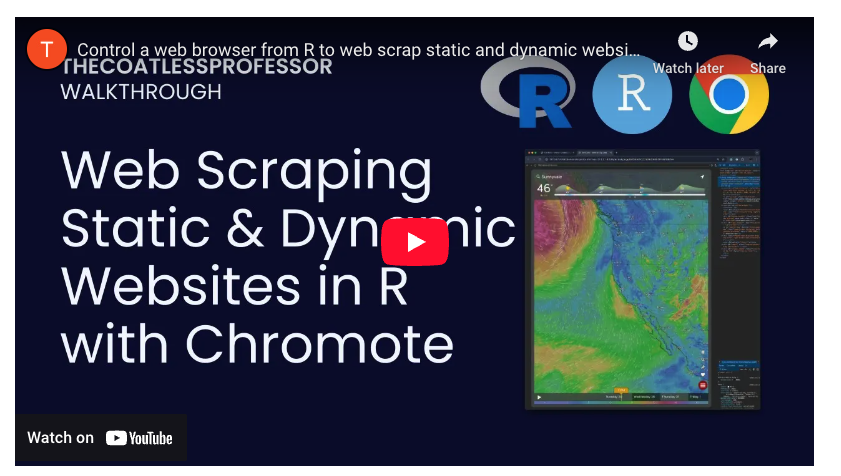
Scraping Dynamic Websites with R and Chromote
scraping
video
Feb 20, 2025
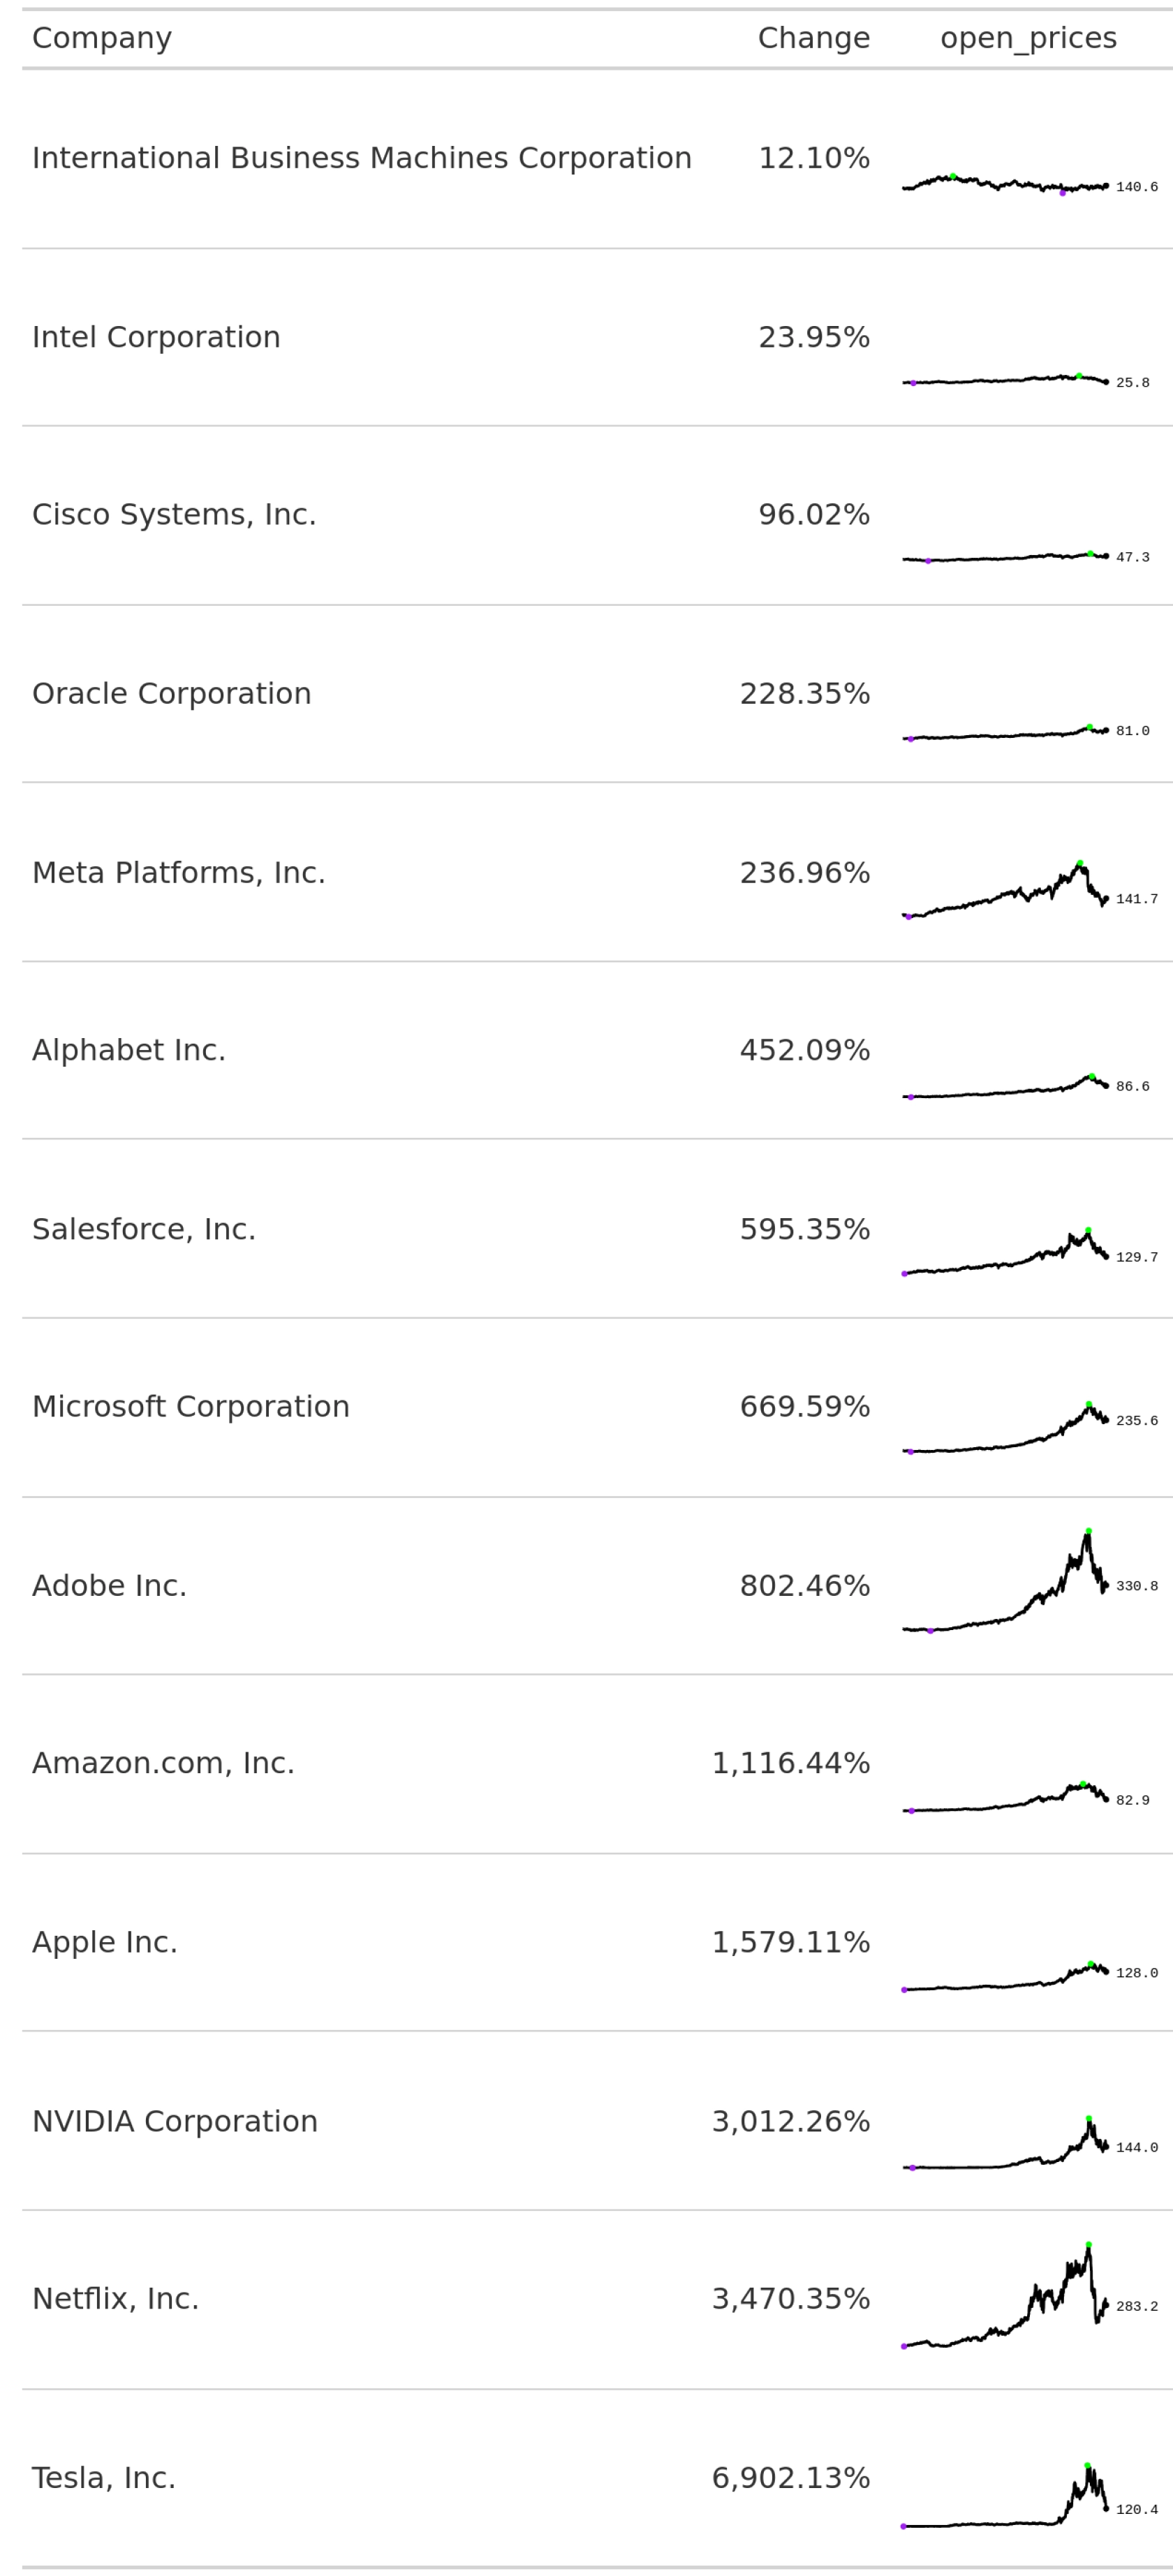
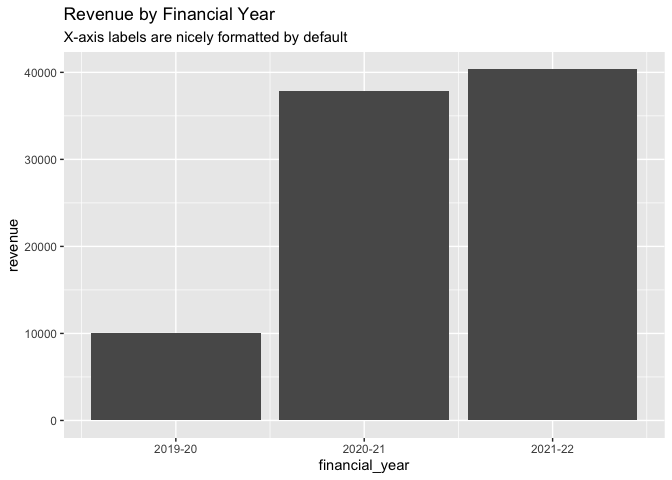
acadyr: Work with Financial and Academic Years in R
Joscelin’s fav
package
Feb 20, 2025
Analyzing International Survey Data with the pewmethods R Package
Joscelin’s fav
Feb 20, 2025
Arrow: Fast Loading and Processing of Large Data
Joscelin’s fav
Feb 20, 2025
PSYCH 252: Statistical Methods at Stanford University
statistics
book
course
Jan 8, 2025
Bookdown: Authoring Books and Technical Documents with R Markdown
markdown
book
Oct 25, 2024
GSpatial Statistics for Data Science: Theory and Practice with R
statistics
book
geospatial
data science
Nov 7, 2023
blsR: Make Requests from the Bureau of Labor Statistics API
API
datasets
Nov 7, 2023
Open Datasets
datasets
Jul 28, 2023
stickr
package
May 29, 2023
Bayesian Hierarchical Models in Ecology
statistics
book
bayesian
May 28, 2023
lm-table-maker
statistics
May 28, 2023
Create a ggalluvial plot in R
visualization
May 28, 2023
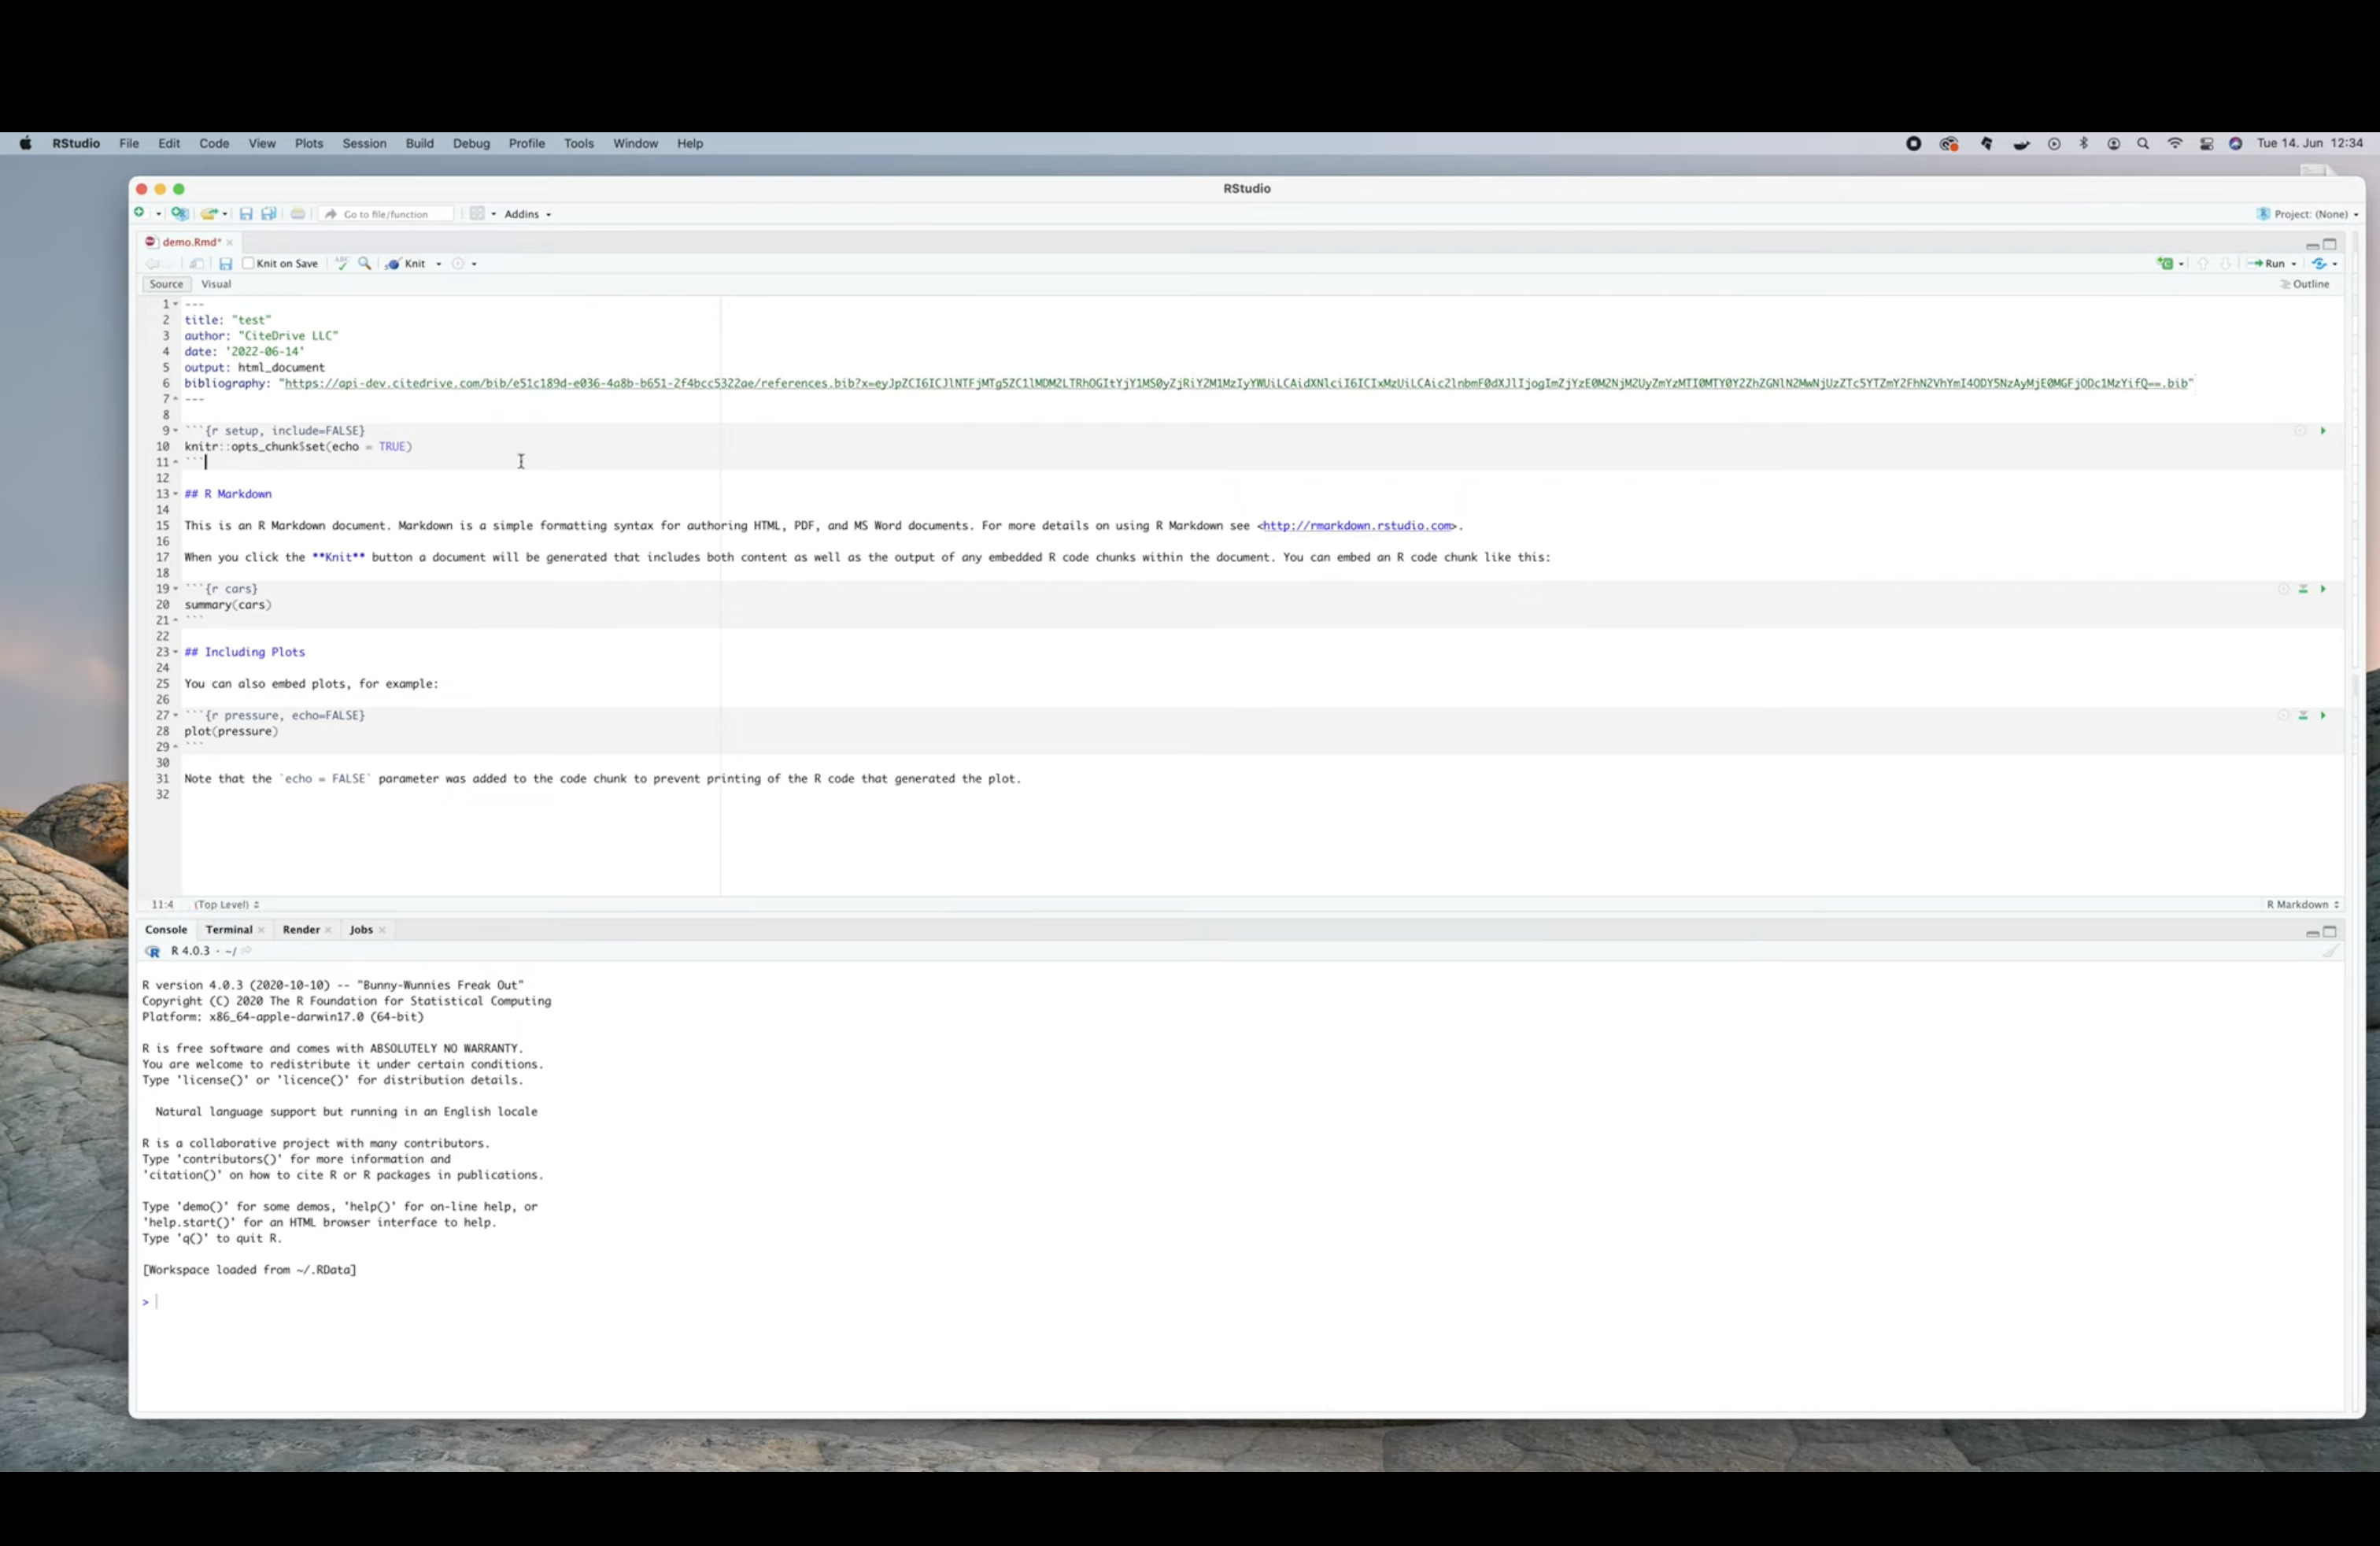
Bibliography management in RStudio with CiteDrive: how to insert references in R-Markdown documents
citation
May 28, 2023
Open Source Research Methods for the Social Sciences
statistics
course
video
May 5, 2023
Creating a blog with Quarto in 10 steps
quarto
Apr 30, 2023
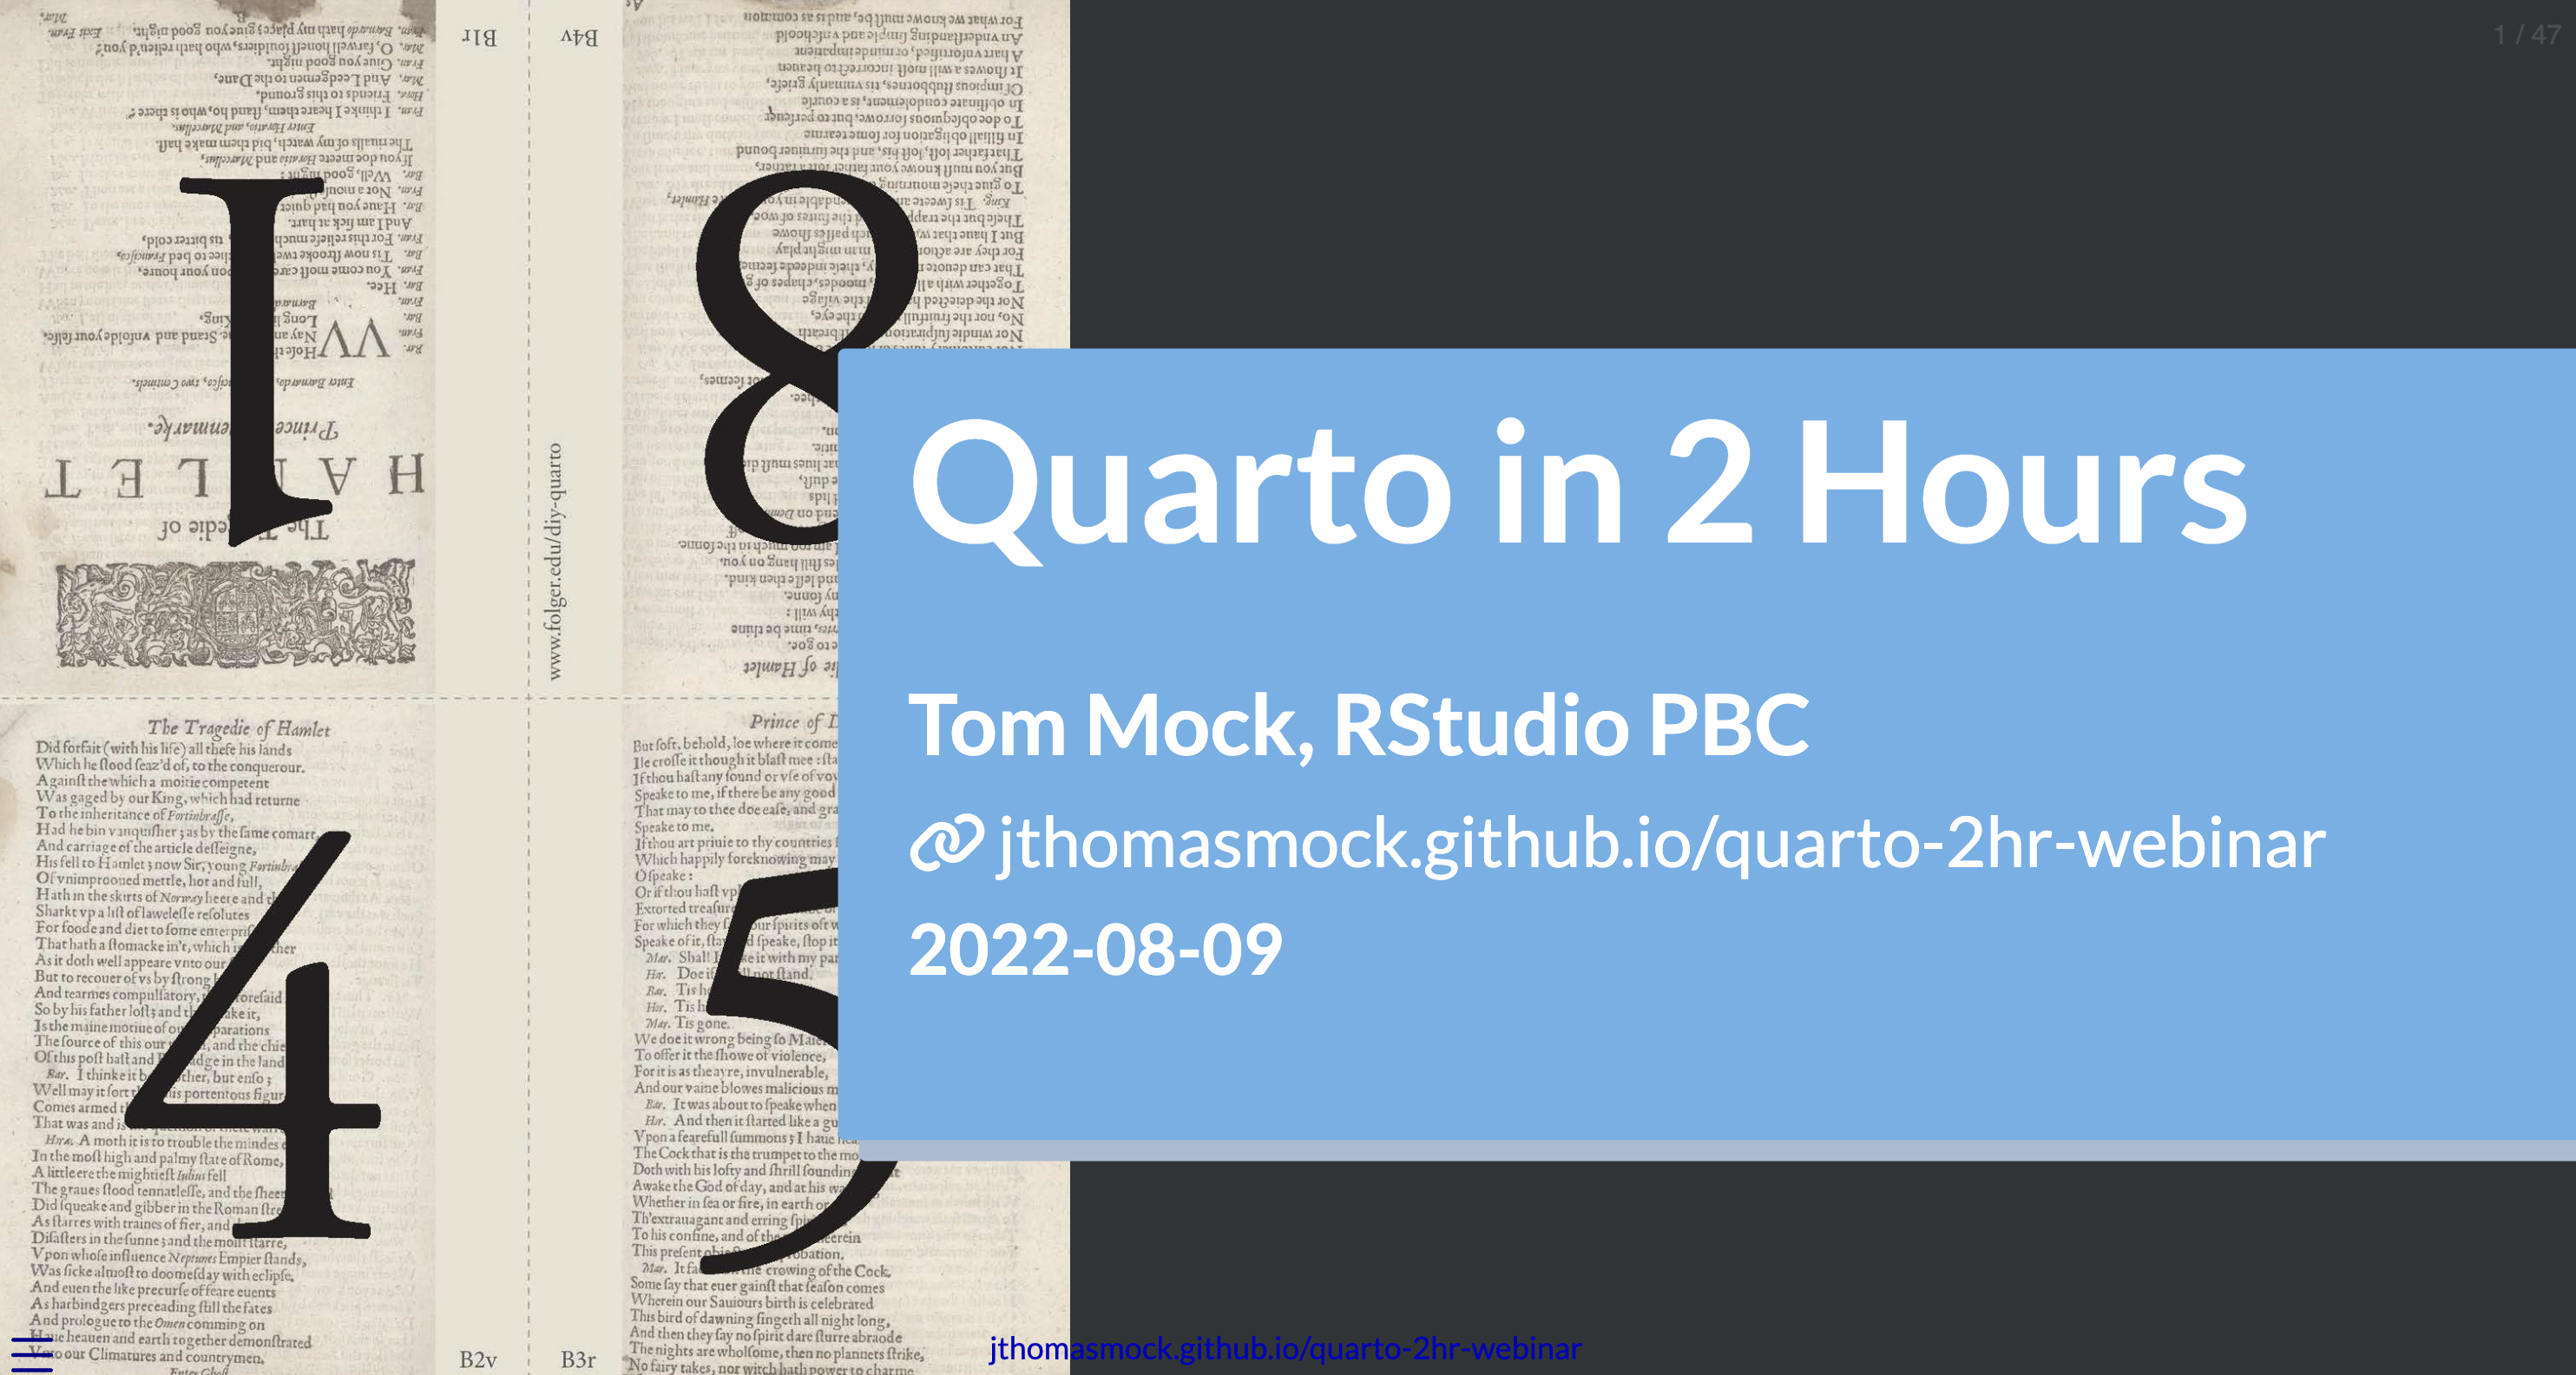
Getting Started with Quarto
quarto
video
Apr 30, 2023
Multivariate Statistics: Using the Right Tool for the Job
statistics
video
Apr 30, 2023
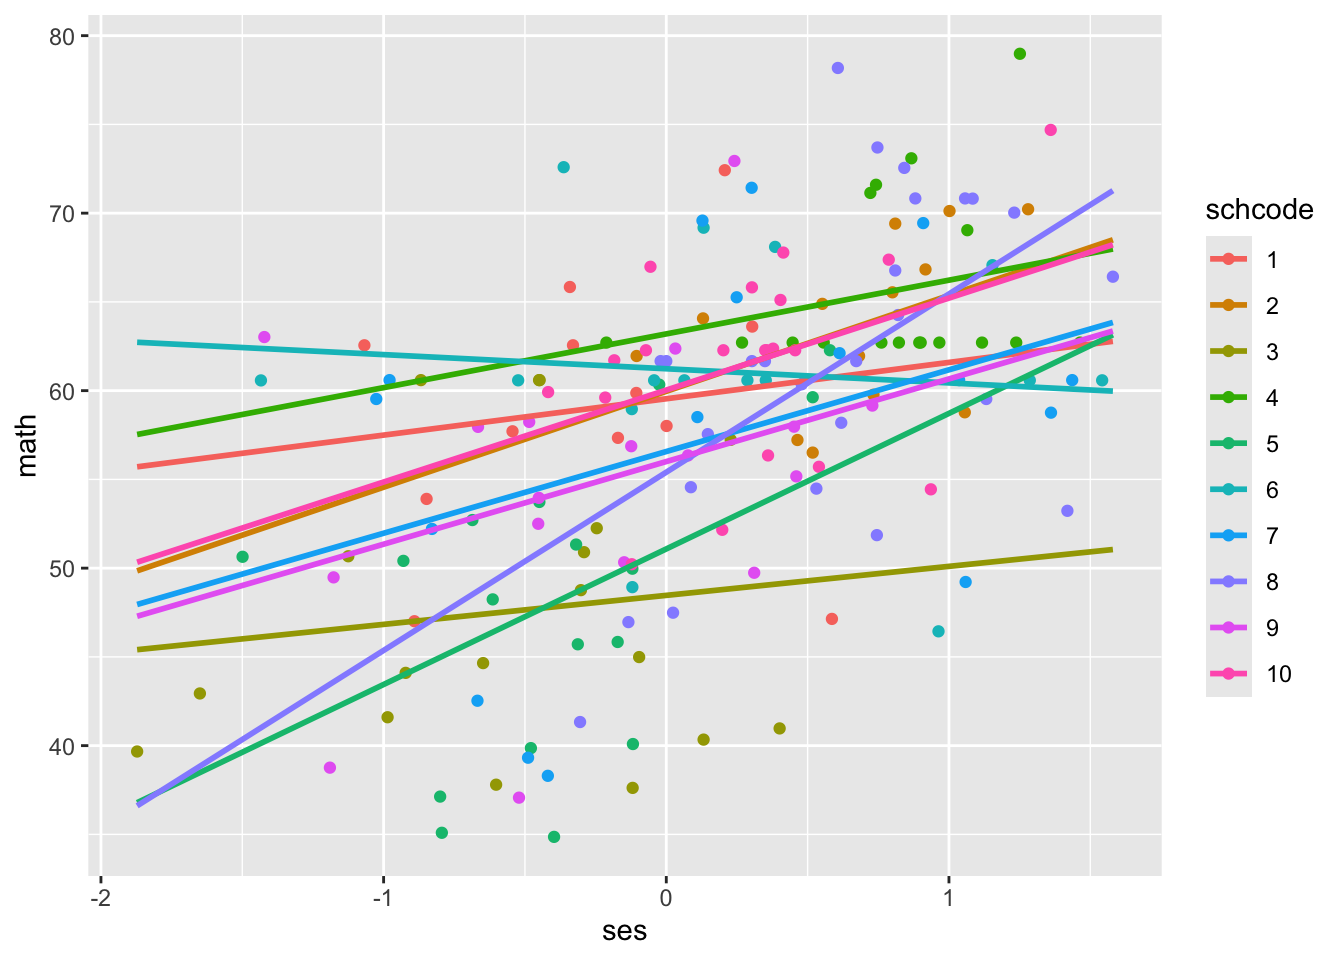
Introduction to Multilevel Modelling
statistics
Apr 30, 2023
Afro Barometer Database
datasets
Apr 28, 2023
American Housing Survey (AHS)
datasets
Apr 28, 2023
ANES-American National Election Studies
datasets
Apr 28, 2023
ARDA (Association of Religion Data Archives) Data Archive
datasets
Apr 28, 2023
British Election Study
datasets
Apr 28, 2023
Chicago Council Survey
datasets
Apr 28, 2023
Cooperative Election Study: Formerly the Cooperative Congressional Election Study
datasets
Apr 28, 2023
Data.gov
datasets
Apr 28, 2023
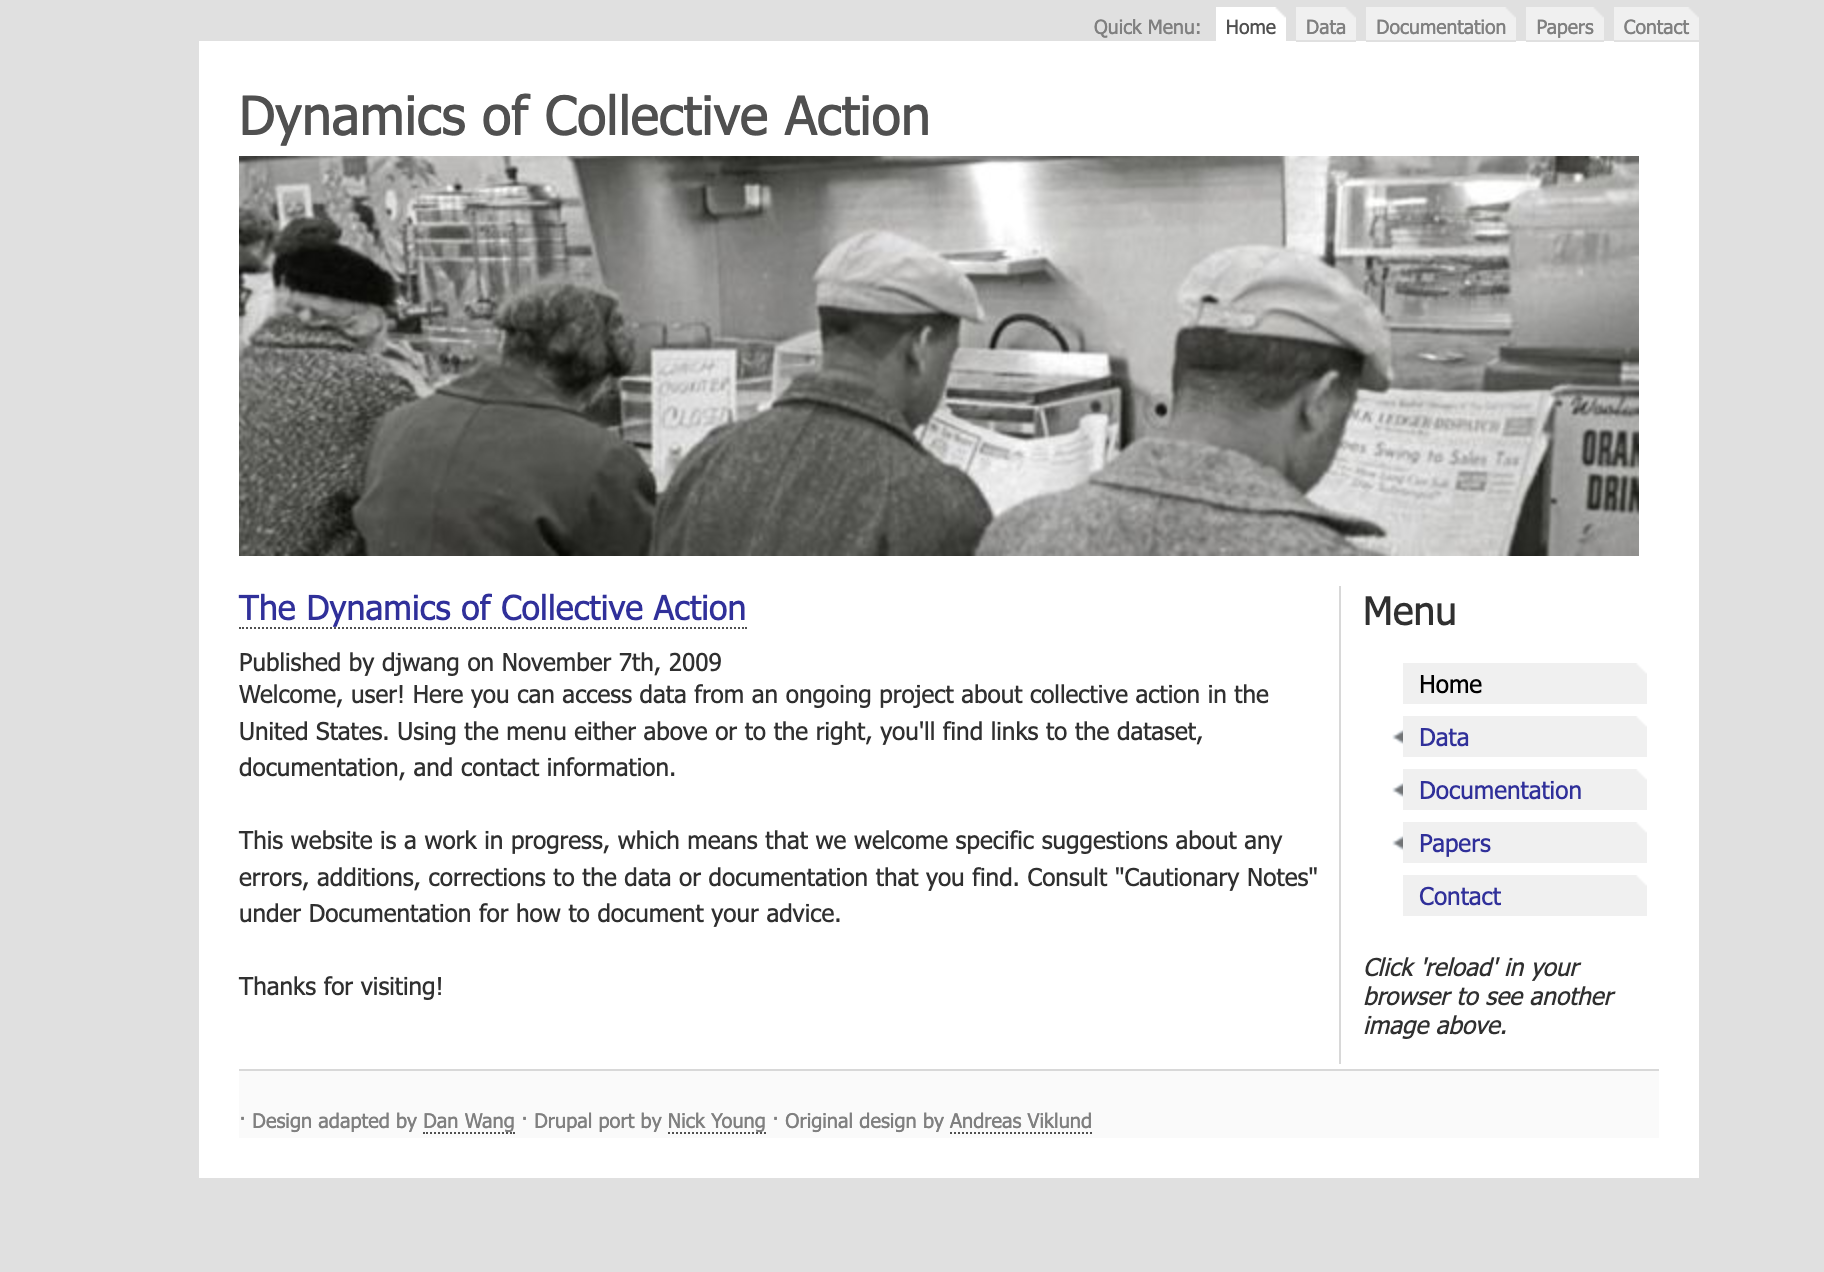
Dynamics of Collective Action
datasets
Apr 28, 2023
General Social Survey - NORC
talk
Apr 28, 2023
LAPOP - AmericasBarometer [Barómetro de las Americas]
datasets
Apr 28, 2023
MIT Election Data + Science Lab
datasets
Apr 28, 2023
Nationals Center for Education Statistics: Longitudinal Studies
datasets
Apr 28, 2023
National Longitudinal Surveys- A program of the U.S. Bureau of Labor Statistics
datasets
Apr 28, 2023
National Epidemiologic Survey on Alcohol and Related Conditions-III (NESARC-III)
datasets
Apr 28, 2023
National Couples’ Health and Time Study (NCHAT)
datasets
Apr 28, 2023
Pew Research Center Logo
talk
Apr 28, 2023
Project on Human Development in Chicago Neighborhoods (PHDCN)
datasets
Apr 28, 2023
Survey Center on American Life
datasets
Apr 28, 2023
Survey Data Driving the Insights
datasets
Apr 28, 2023
2022- World Population Data Sheet
datasets
Apr 28, 2023
Astonishingly easy mapping in R with mapview
visualization
Apr 24, 2023
R for Data Analysis
statistics
book
Apr 14, 2023
Use GIT like a professional software engineer!: Git and GitHub Crash Course for beginners
git
github
not r related
Apr 14, 2023
Statistical rethinking with brms, ggplot2, and the tidyverse: Second edition
statistics
book
Jan 26, 2023
An Introduction to R Markdown
markdown
intro
Sep 22, 2022
Hello Quarto
talk
Jul 28, 2022
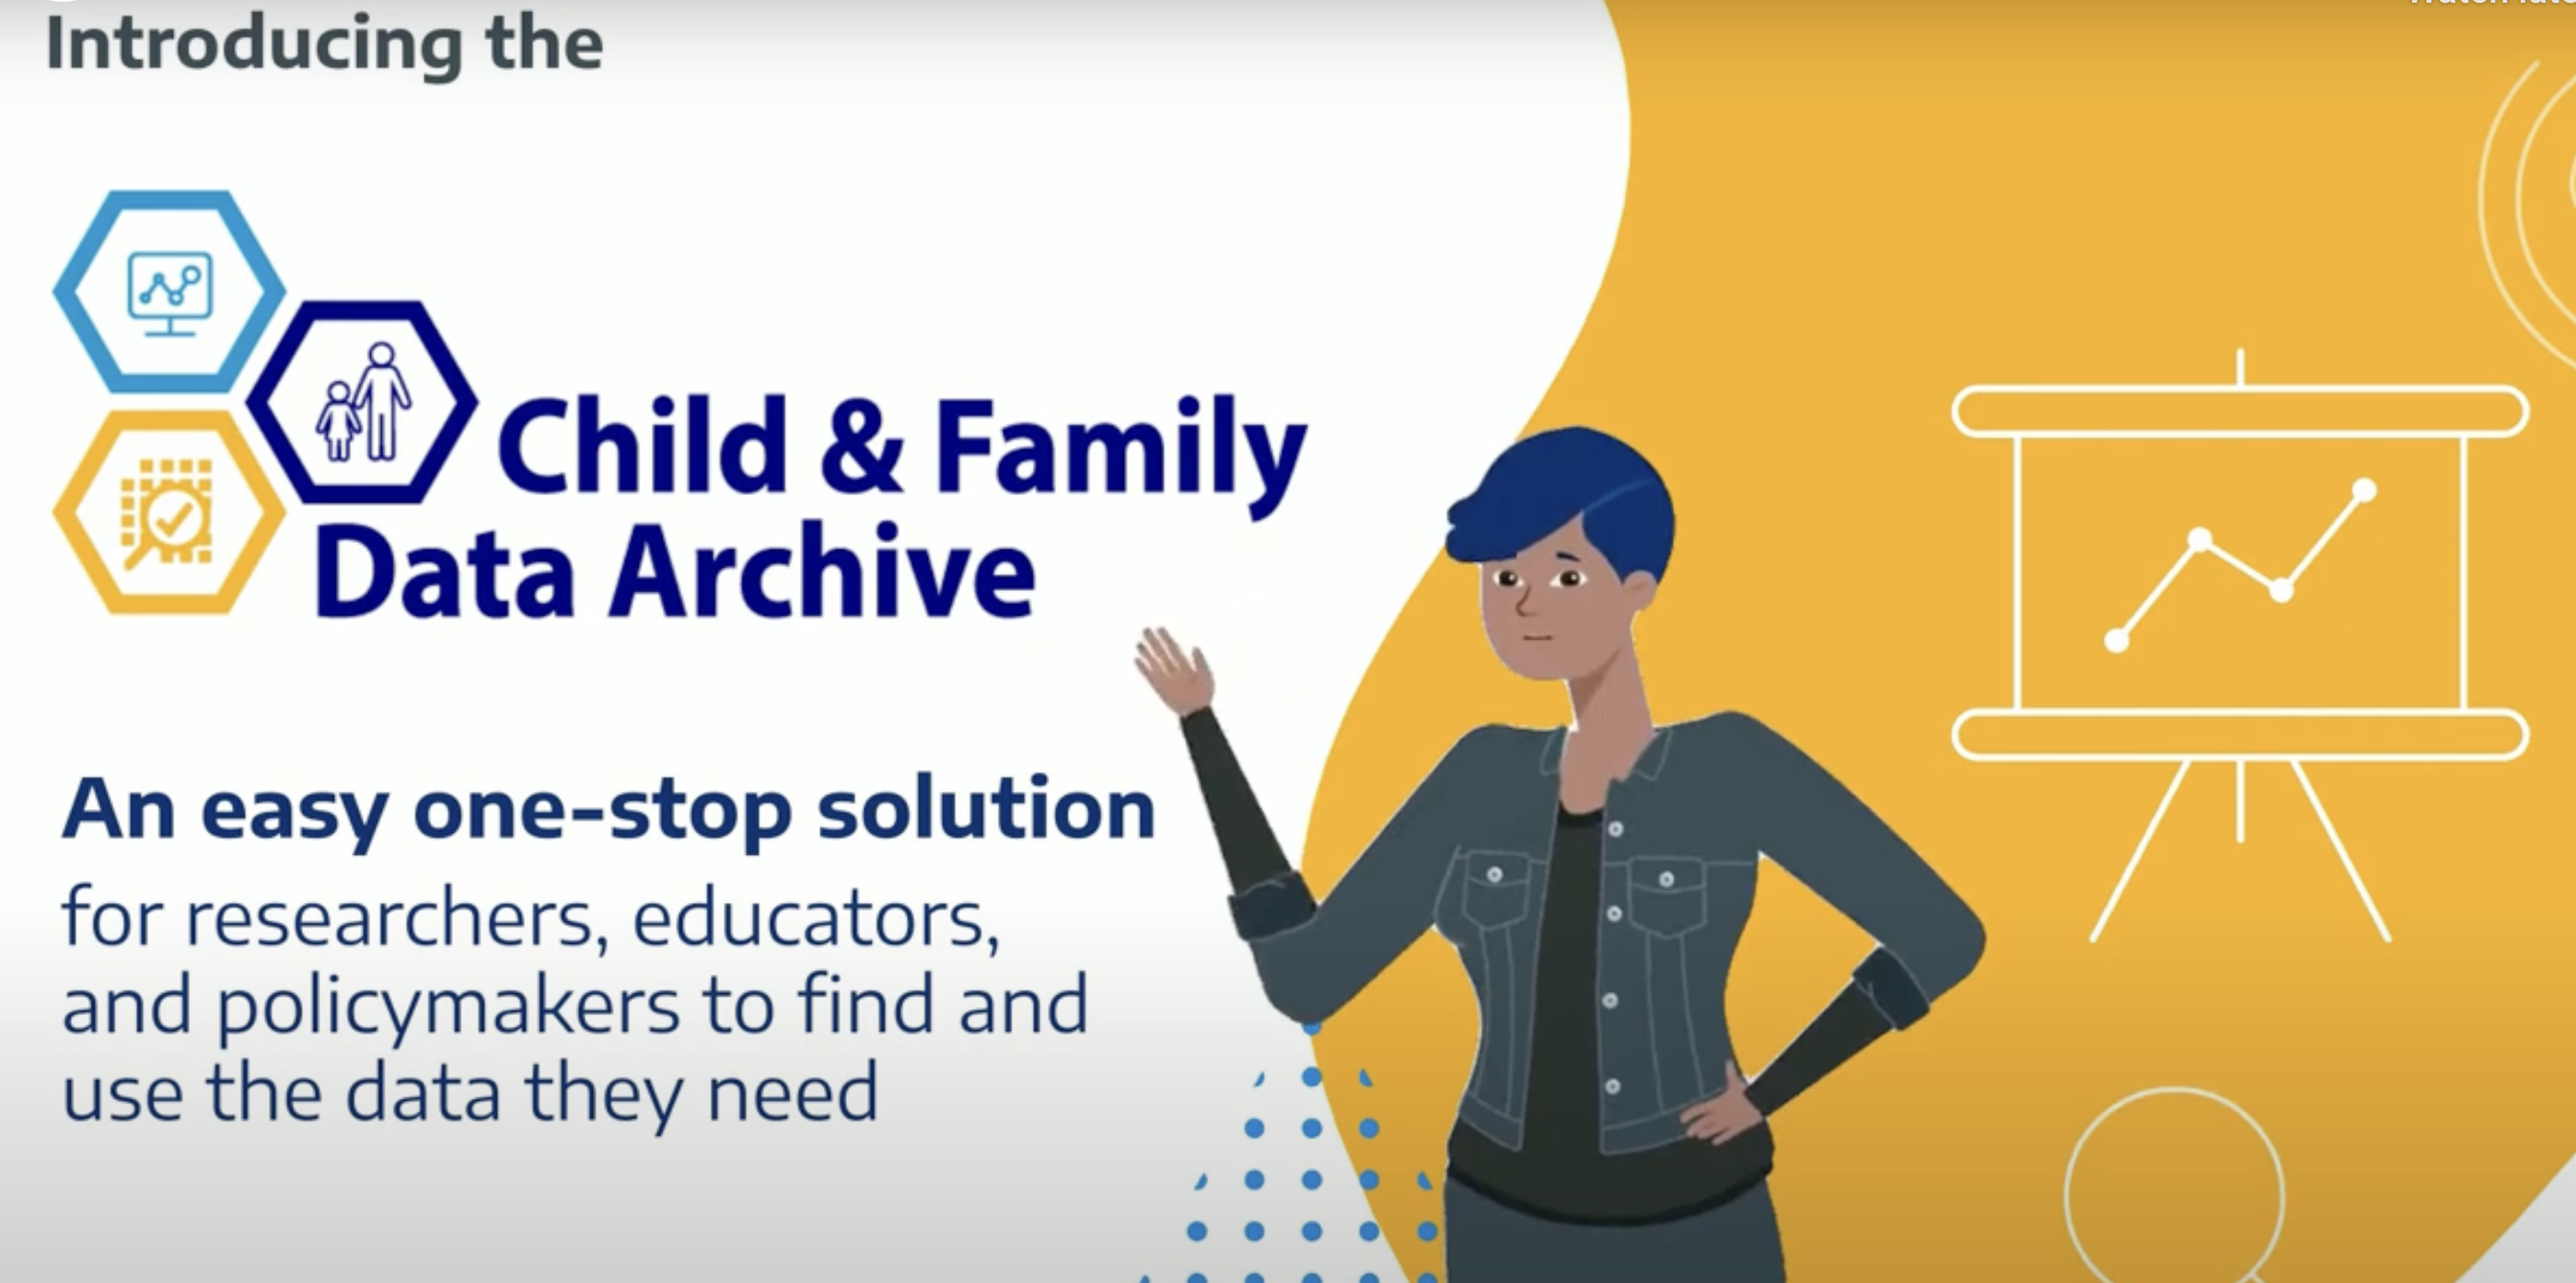
Child and Family Data Archive
datasets
Jul 28, 2022
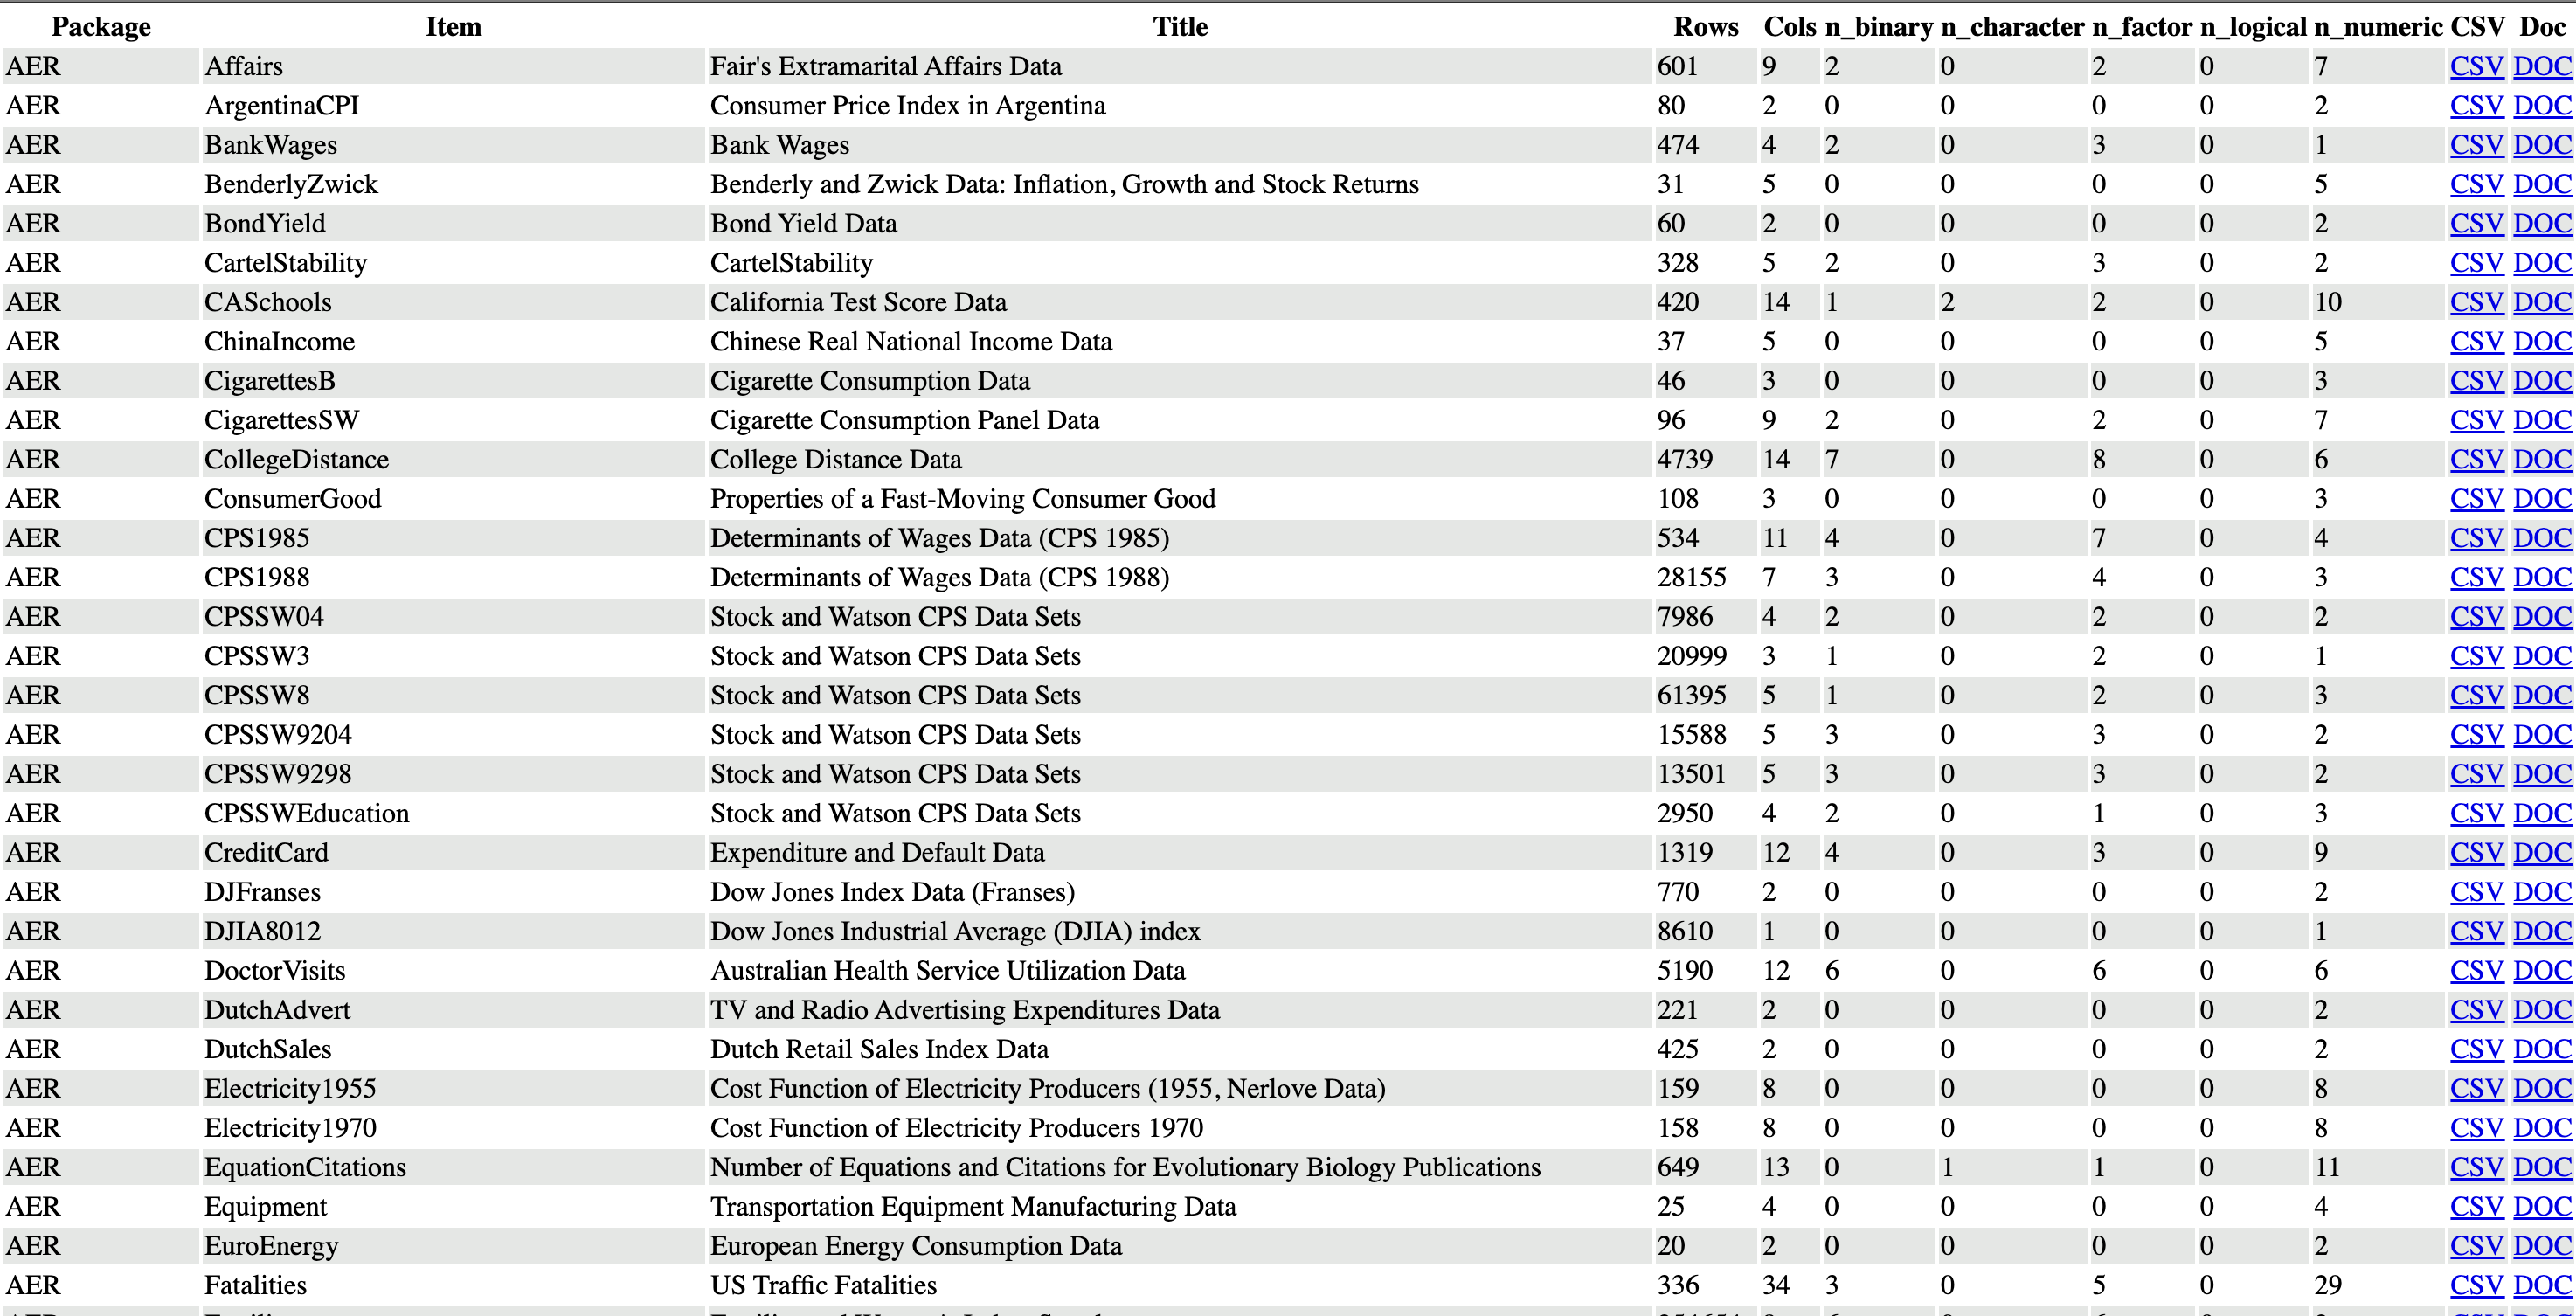
Datasets found in R
datasets
Jul 28, 2022
Datasets from course: Modelling and visualizing data using R: A practical introduction.
datasets
Jul 28, 2022
Introduction to Data Science
machine learning
statistics
book
Jul 23, 2022
Streamlining with R
learning R
intro
Jul 12, 2022
Writing Reproducible Research Papers with R Markdown
markdown
May 24, 2022
Tidy Data Tutor
teaching r
python
Feb 18, 2022
Pydon’ts – Write elegant Python code
python
not r related
Dec 23, 2021
Plotnine: Grammar of Graphics for Python
python
visualization
Dec 22, 2021
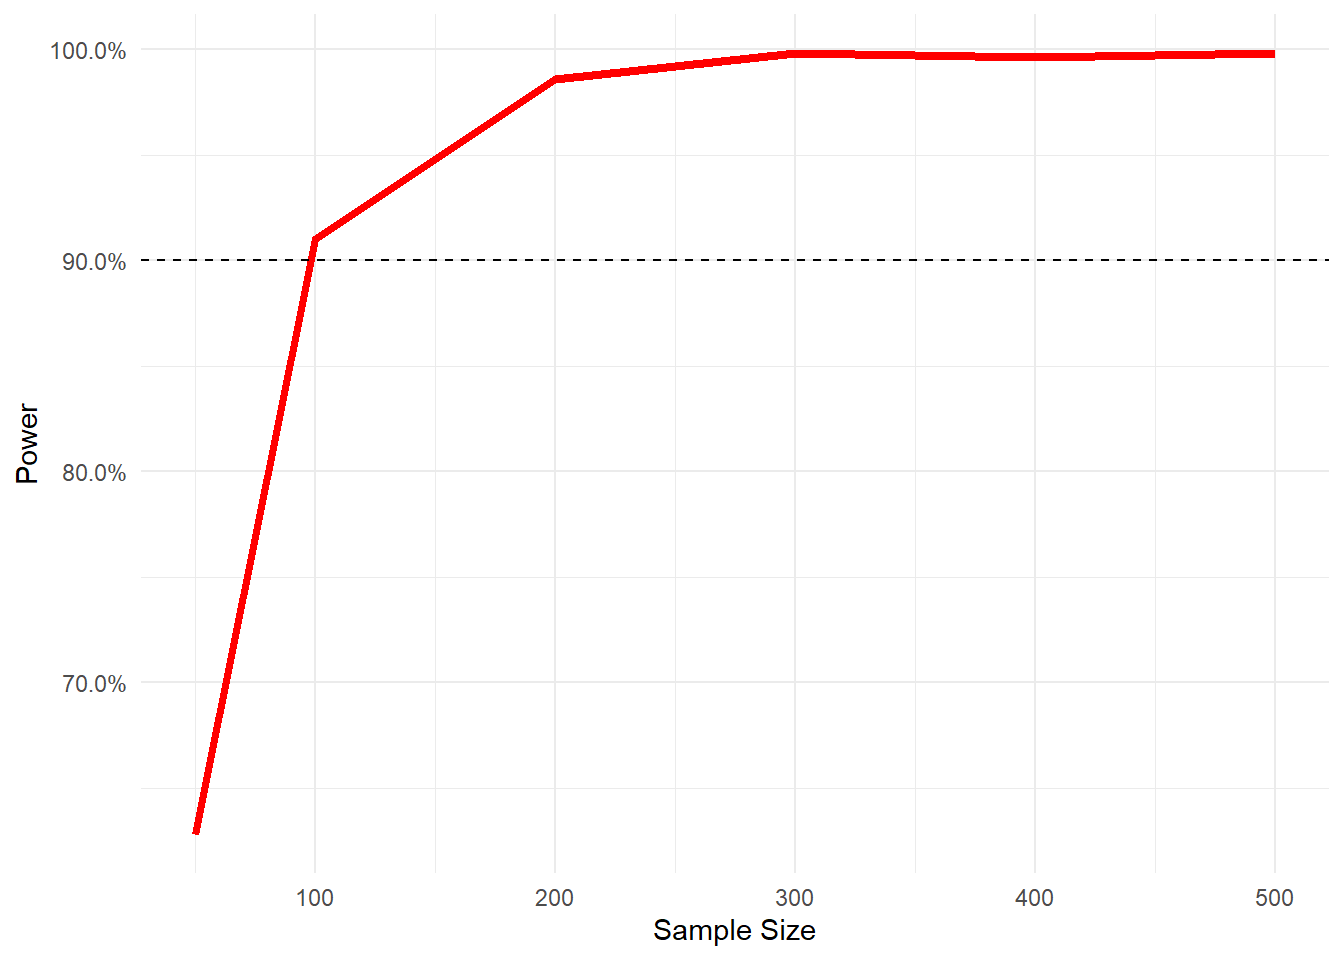
Simulation for Power Analysis
statistics
slides
Dec 20, 2021
Heuristics for Translating ggplot2 Code to Plotnine Code
python
visualization
Dec 13, 2021
A Byte of Python
python
not r related
Dec 12, 2021
Coming from R chapter from the book Coding for Economics
python
book
Dec 12, 2021
Data Analysis for Business, Economics, and Policy
python
not r related
Dec 12, 2021
r-to-python-data-wrangling-basics.md
python
Dec 12, 2021
A guide to working with country-year panel data and Bayesian multilevel models
statistics
bayesian
Dec 12, 2021
Alternatives to Simple Color Legends in ggplot2
visualization
blog
Dec 12, 2021
Dataset from ‘R, Python and Stata code for Data Analysis for Business, Economics, and Policy’ book
datasets
Dec 12, 2021
Extending R Markdown
markdown
Dec 11, 2021
Python Data Science Handbook
python
book
not r related
Dec 11, 2021
Python Exercises
python
not r related
Dec 10, 2021
Python & R for the Modern Data Scientist
python
Joscelin’s fav
book
Dec 8, 2021
Python Tutorials
python
video
Dec 5, 2021
Statistics of DOOM Youtube Channel
statistics
video
Dec 2, 2021
Research Methods in Practice 1
statistics
book
Oct 22, 2021
Bayesian statistics with R
statistics
bayesian
video
Oct 12, 2021
Linear Mixed Effects Models - R
statistics
intro
Oct 12, 2021
Reproducible science workshop: A one-day workshop with R and RStudio
data science
tidyverse
visualization
wrangling
talk
video
Oct 8, 2021
Handling missing values in R
statistics
missing data
Jun 6, 2021
Running Multiple Linear Regression Models in for-Loop
statistics
Jun 6, 2021
corrmorant: Flexible Correlation Matrices Based on ggplot2
visualization
package
statistics
Jun 6, 2021
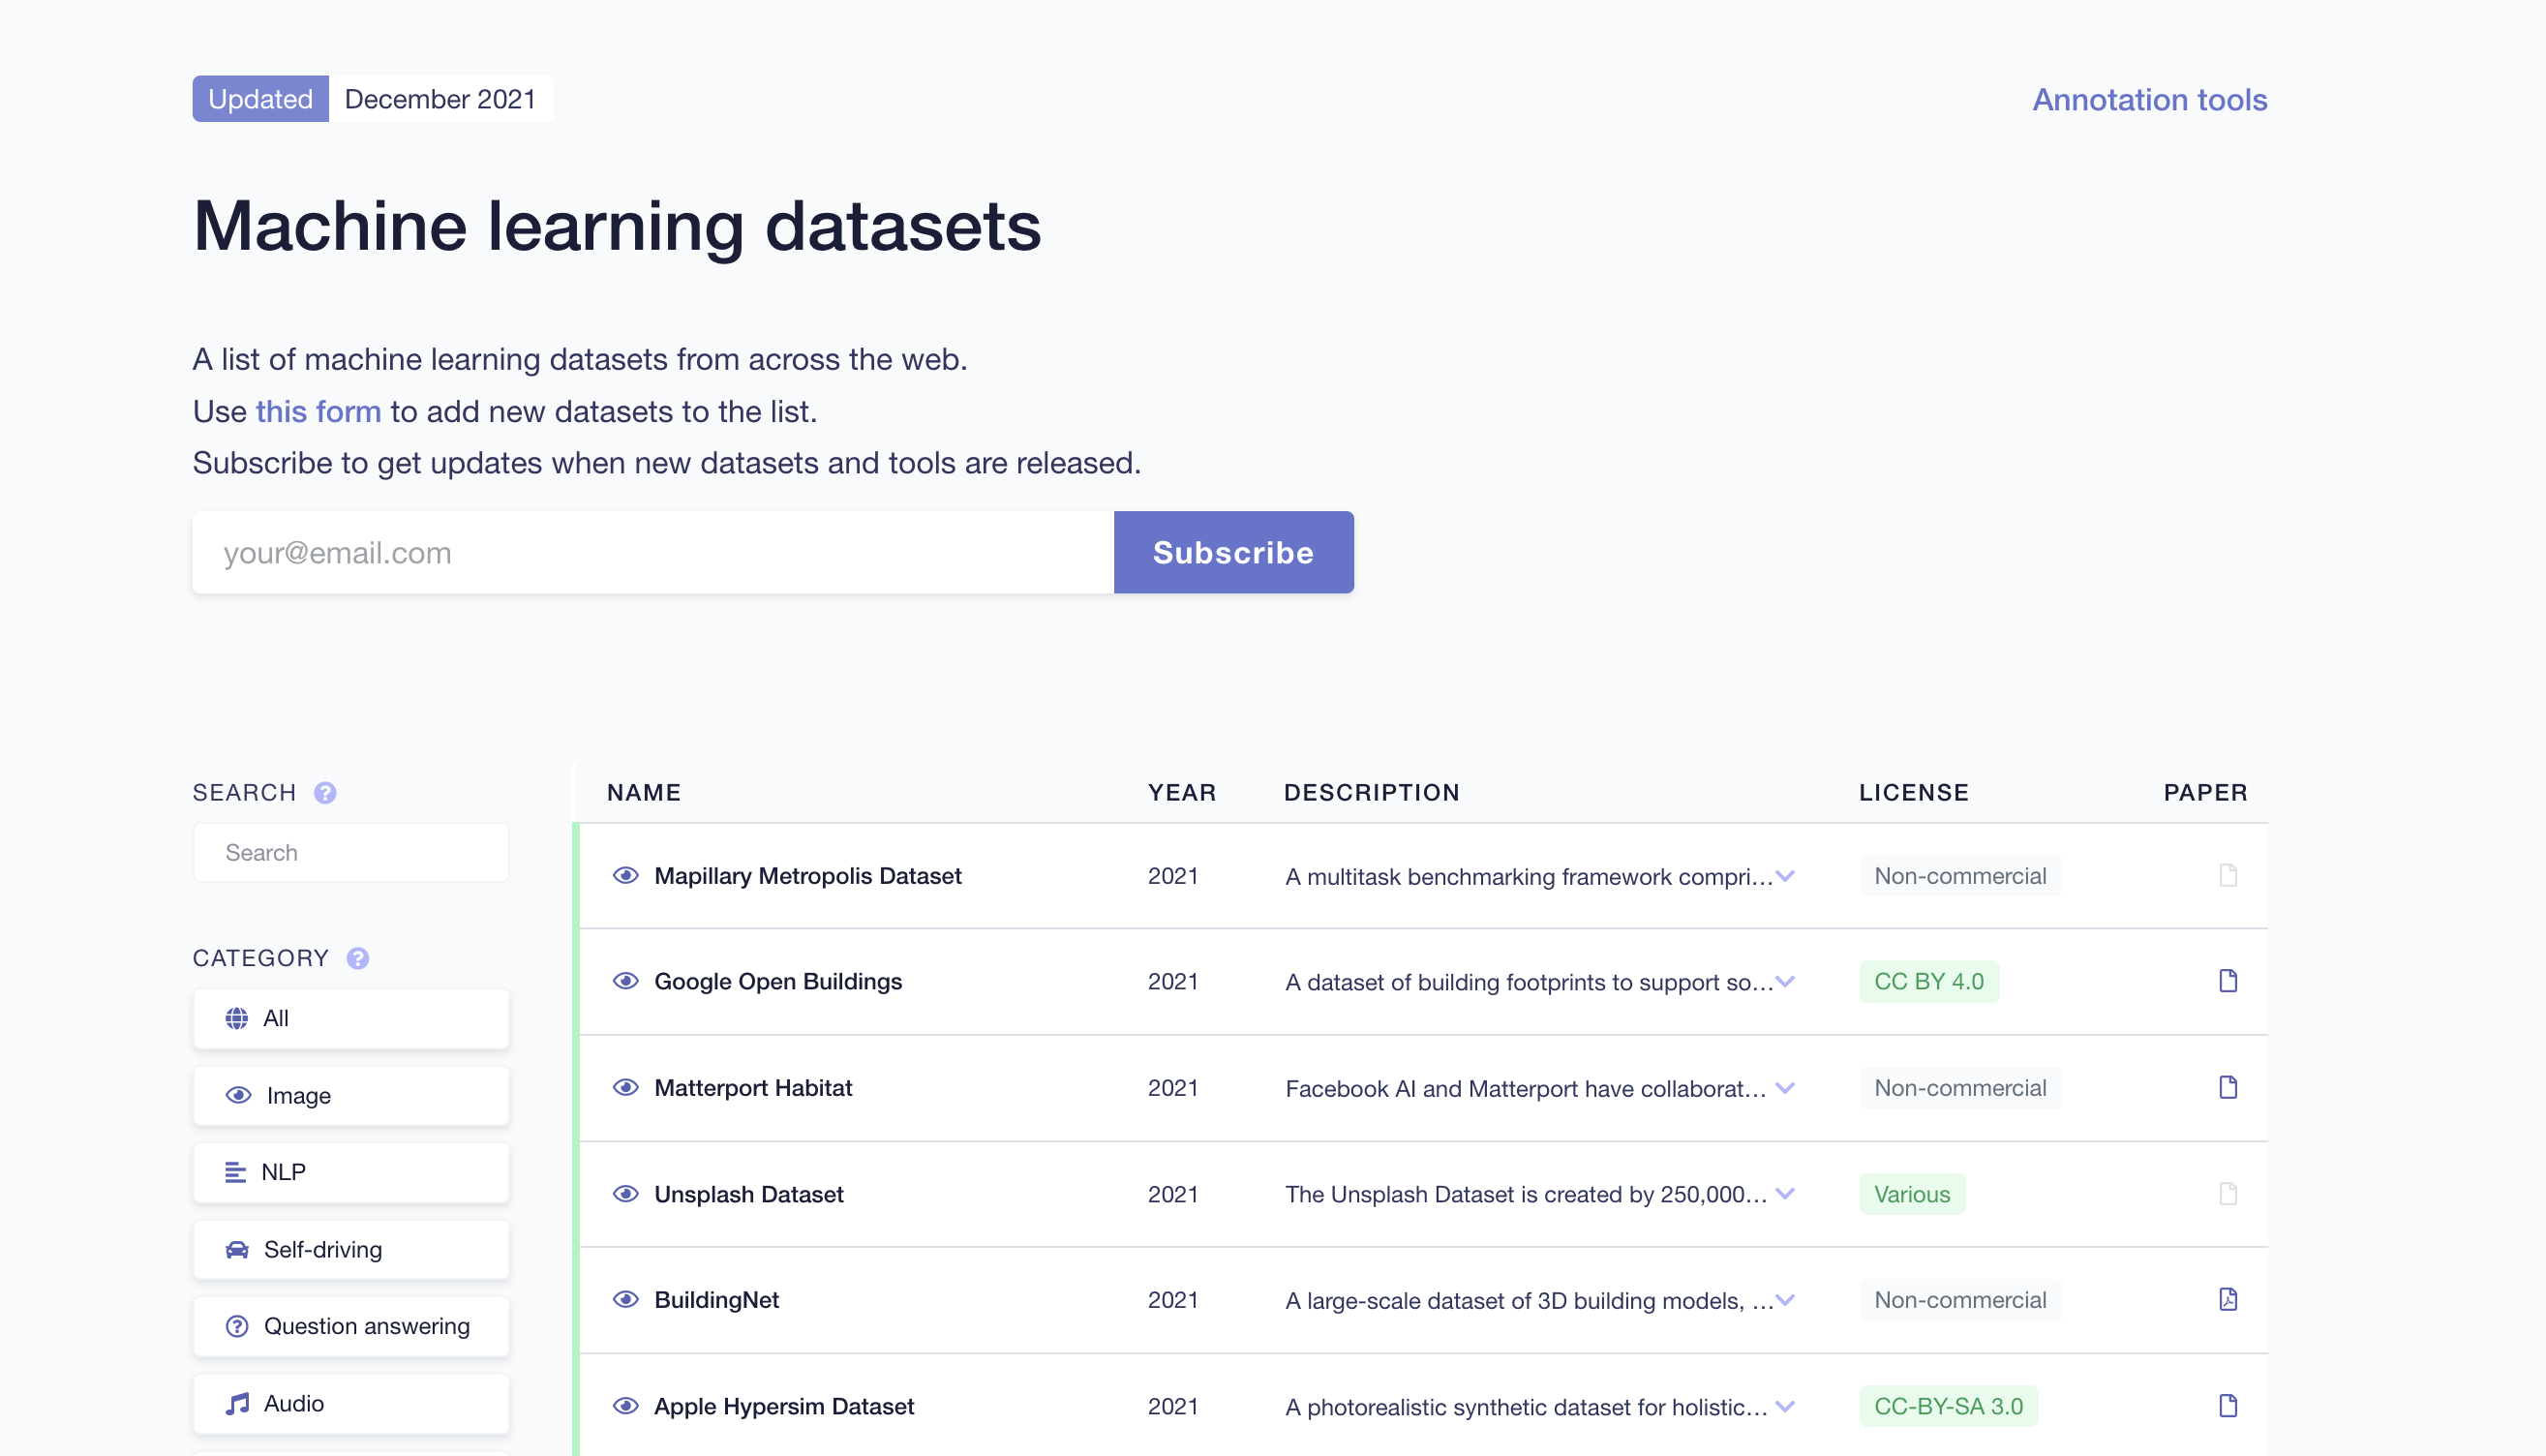
Datasets: Machine learning datasets
datasets
Jun 6, 2021
Machine learning datasets
datasets
Jun 6, 2021
gm: Generating music easily
missing data
Jun 6, 2021
Accessing open book data with openlibraryR
API
Apr 22, 2021
Statistical Analysis and Visualizations Using R
statistics
course
intro
visualization
Apr 15, 2021
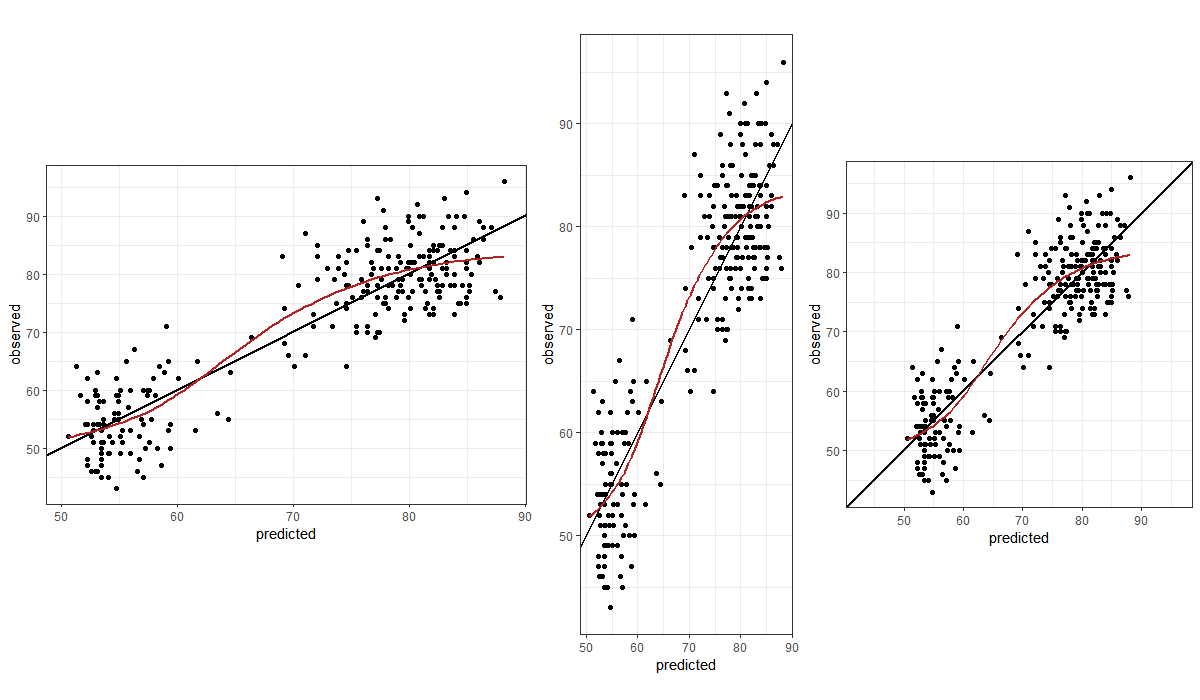
Check how good your model is using Performance package
statistics
package
Dec 31, 2020
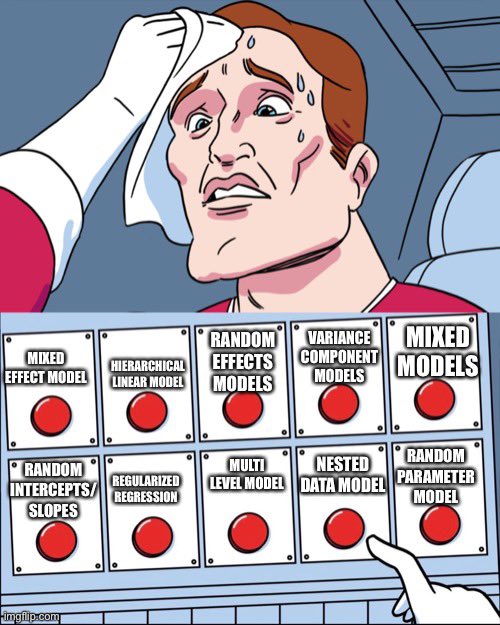
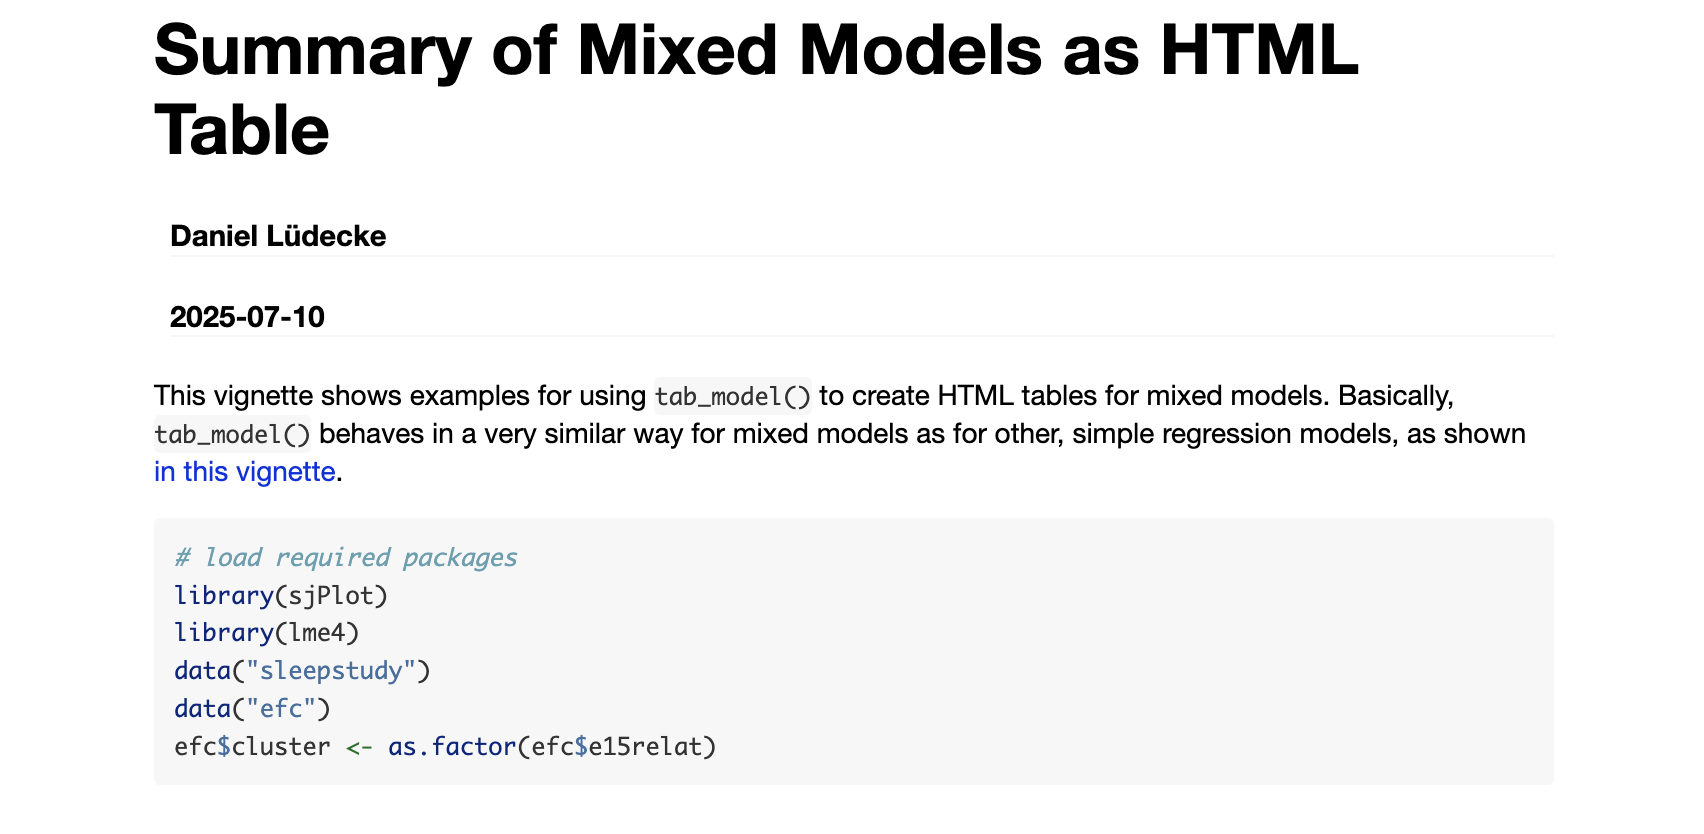
Summary of Mixed Models as HTML Table
statistics
Dec 31, 2020
Plotting brain atlases in ggplot
neuro
Dec 25, 2020
neuropointillist
neuro
mri
Dec 24, 2020
Package eegUtils
neuro
eeg
package
Dec 22, 2020
Neuroconductor
neuro
Dec 22, 2020
Package EEGSpectralAnalysis details
neuro
eeg
Dec 17, 2020
Processing fMRI Data in R
neuro
mri
Dec 15, 2020
R for statistical analysis of fMRI data
neuro
mri
Dec 14, 2020
NIRStat: Novel Statistical Methods for Studying Near-Infrared Spectroscopy (NIRS) Time Series Data
neuro
nirs
package
Dec 13, 2020
Package brainGraph
neuro
mri
package
Dec 13, 2020
freesurferformats: R Package For Reading and Writing Neuroimaging File Formats
neuro
Dec 13, 2020
Methods for Quantitative Magnetic Resonance Imaging (‘qMRI’)
neuro
Dec 13, 2020
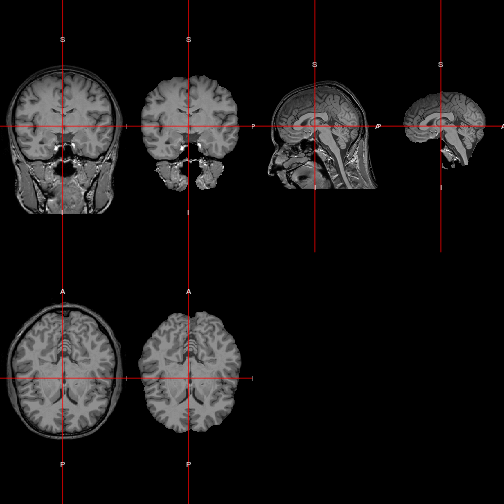
Visualization of MRI data in R
neuro
mri
Dec 13, 2020
fsbrain: an R package for the visualization of structural neuroimaging data
neuro
package
Dec 13, 2020
Working with fMRI data using R
neuro
mri
Dec 13, 2020
fmri Functions and Package
neuro
mri
package
Dec 13, 2020
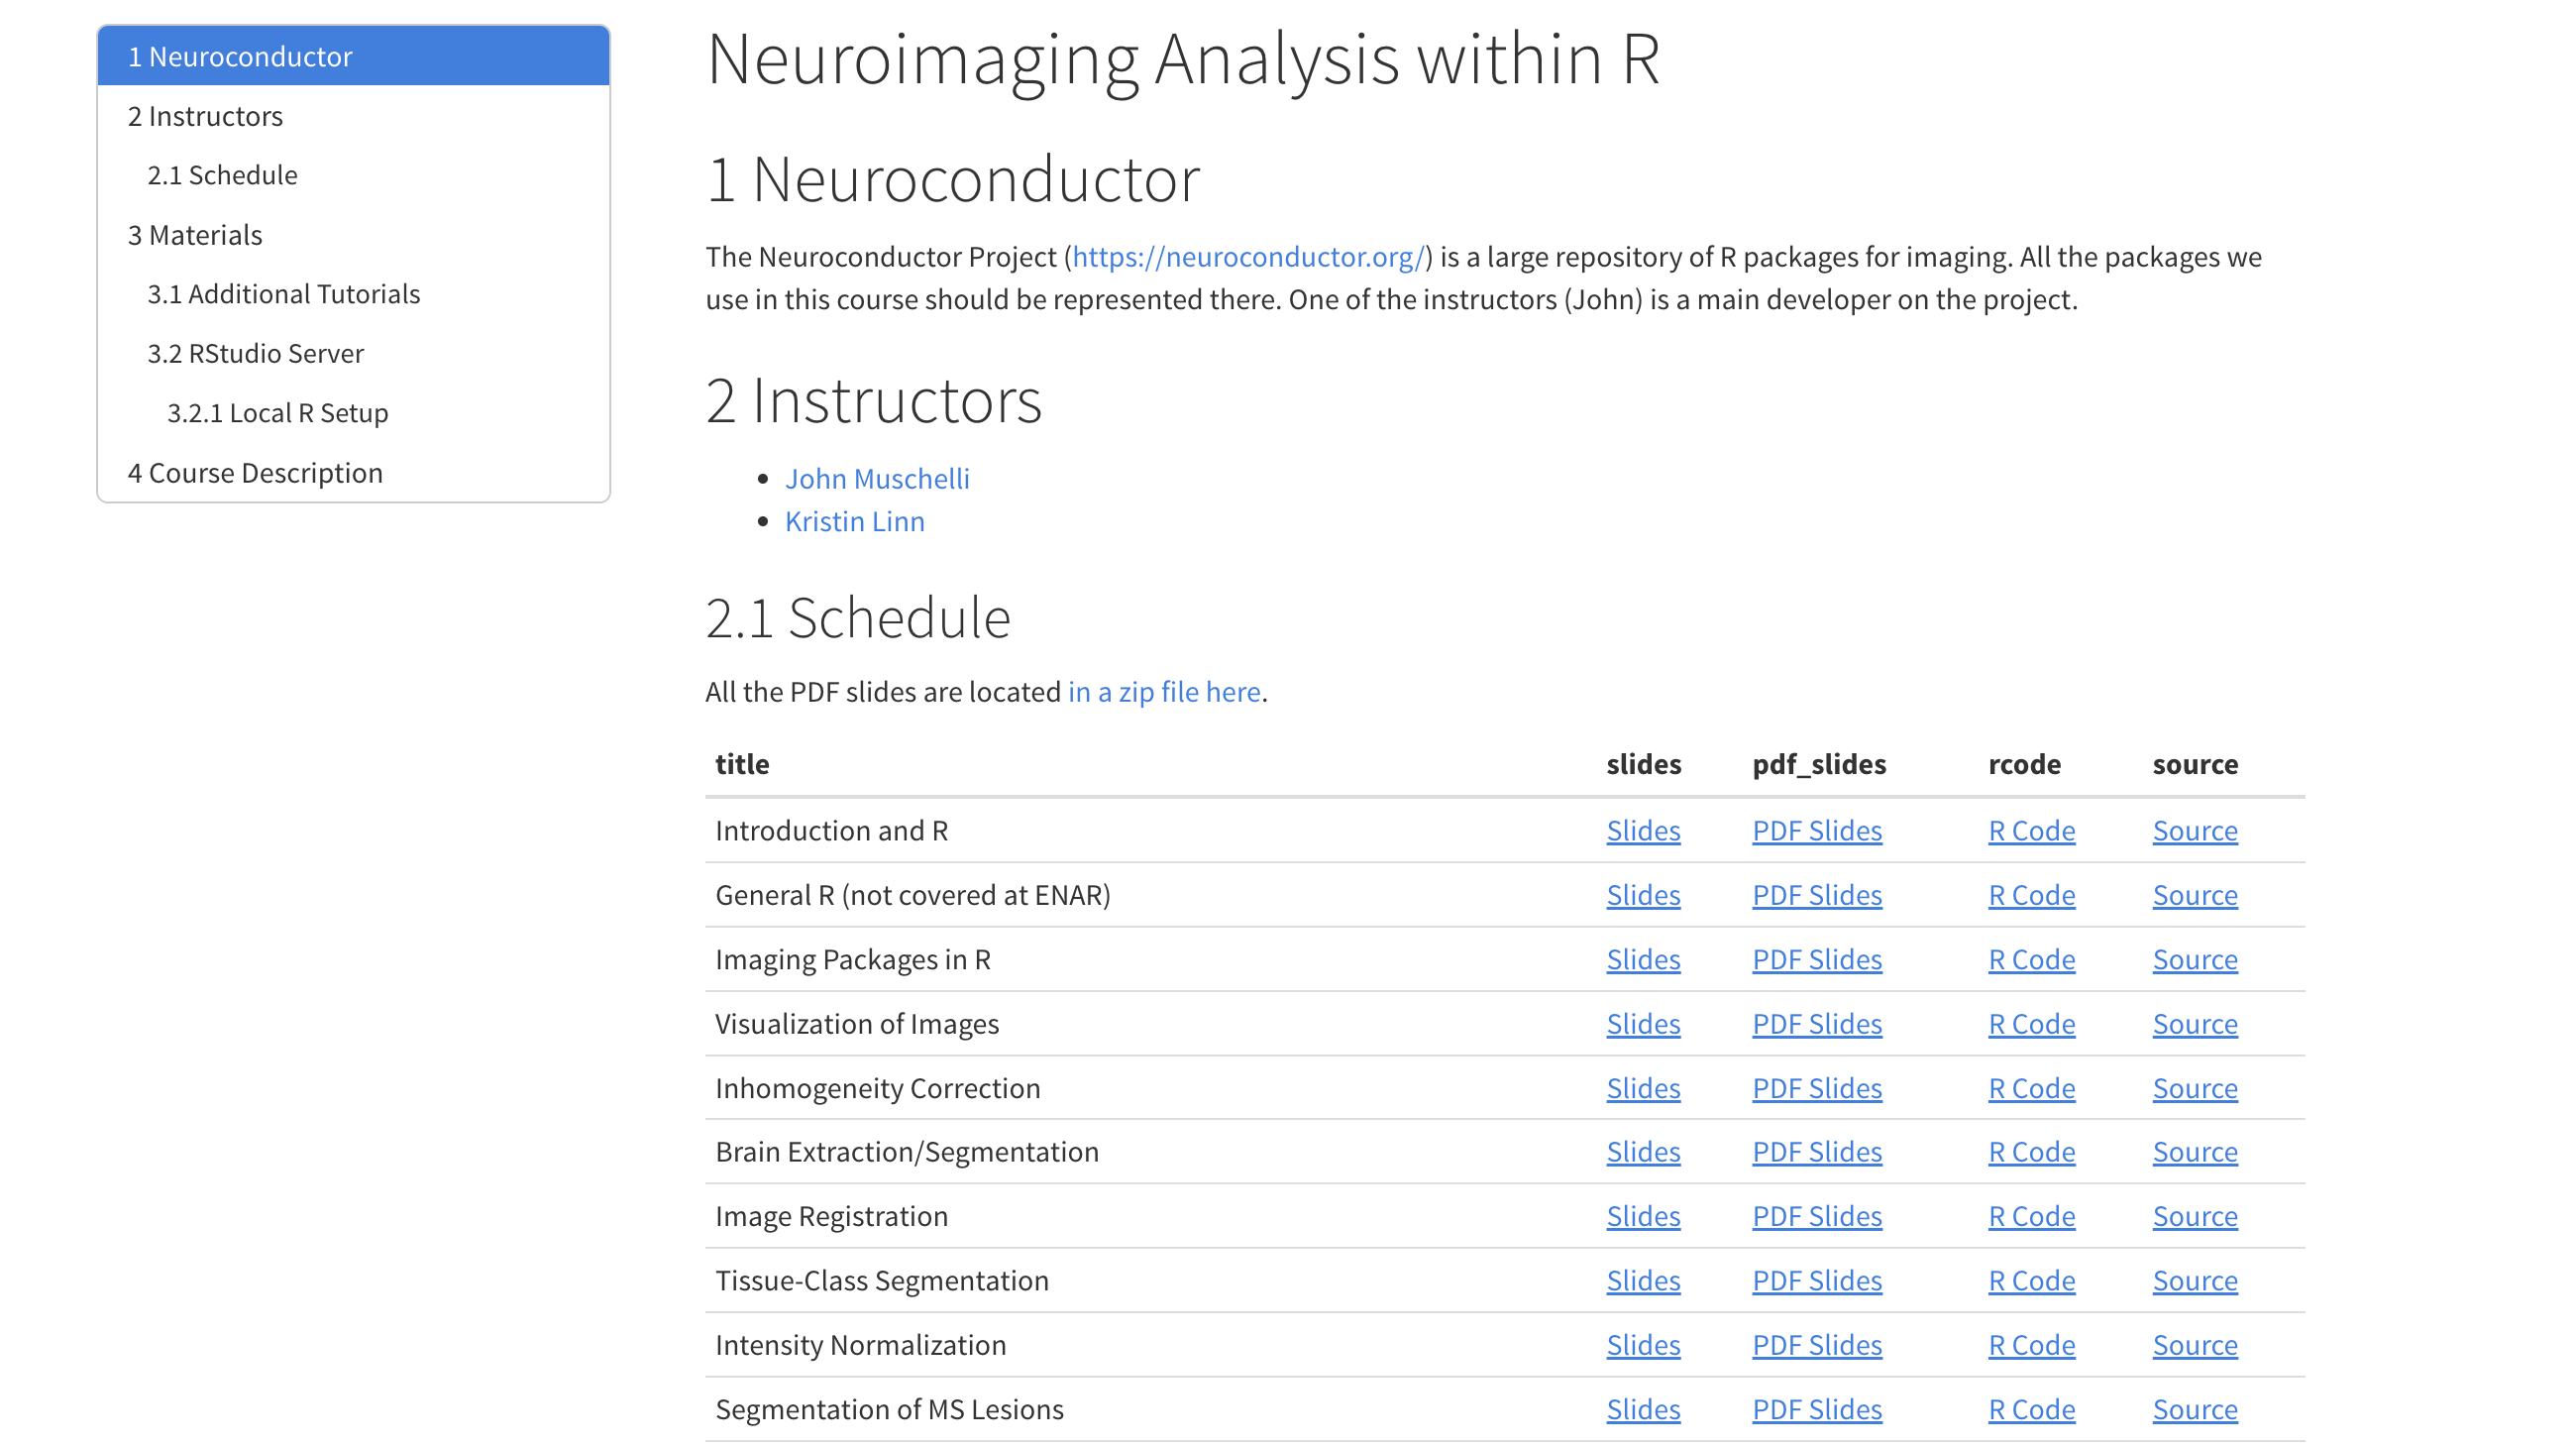
Neuroimaging Analysis within R
neuro
Dec 13, 2020
Using the tidyverse with Databases
tidyverse
databases
SQL
Dec 12, 2020
Mastering Software Development in R
software dev
book
Oct 25, 2020
RStudio Crash Course for beginners 2020 | How To Use The IDE
intro
video
Oct 25, 2020
Git for Academics
git
video
Oct 25, 2020
The Missing Semester of Your CS Education
course
not r related
Oct 25, 2020
Version Control with Git
git
github
not r related
Oct 25, 2020
A ggplot2 grammar guide
visualization
Joscelin’s fav
Sep 14, 2020
A ggplot2 Tutorial for Beautiful Plotting in R
visualization
Joscelin’s fav
Sep 14, 2020
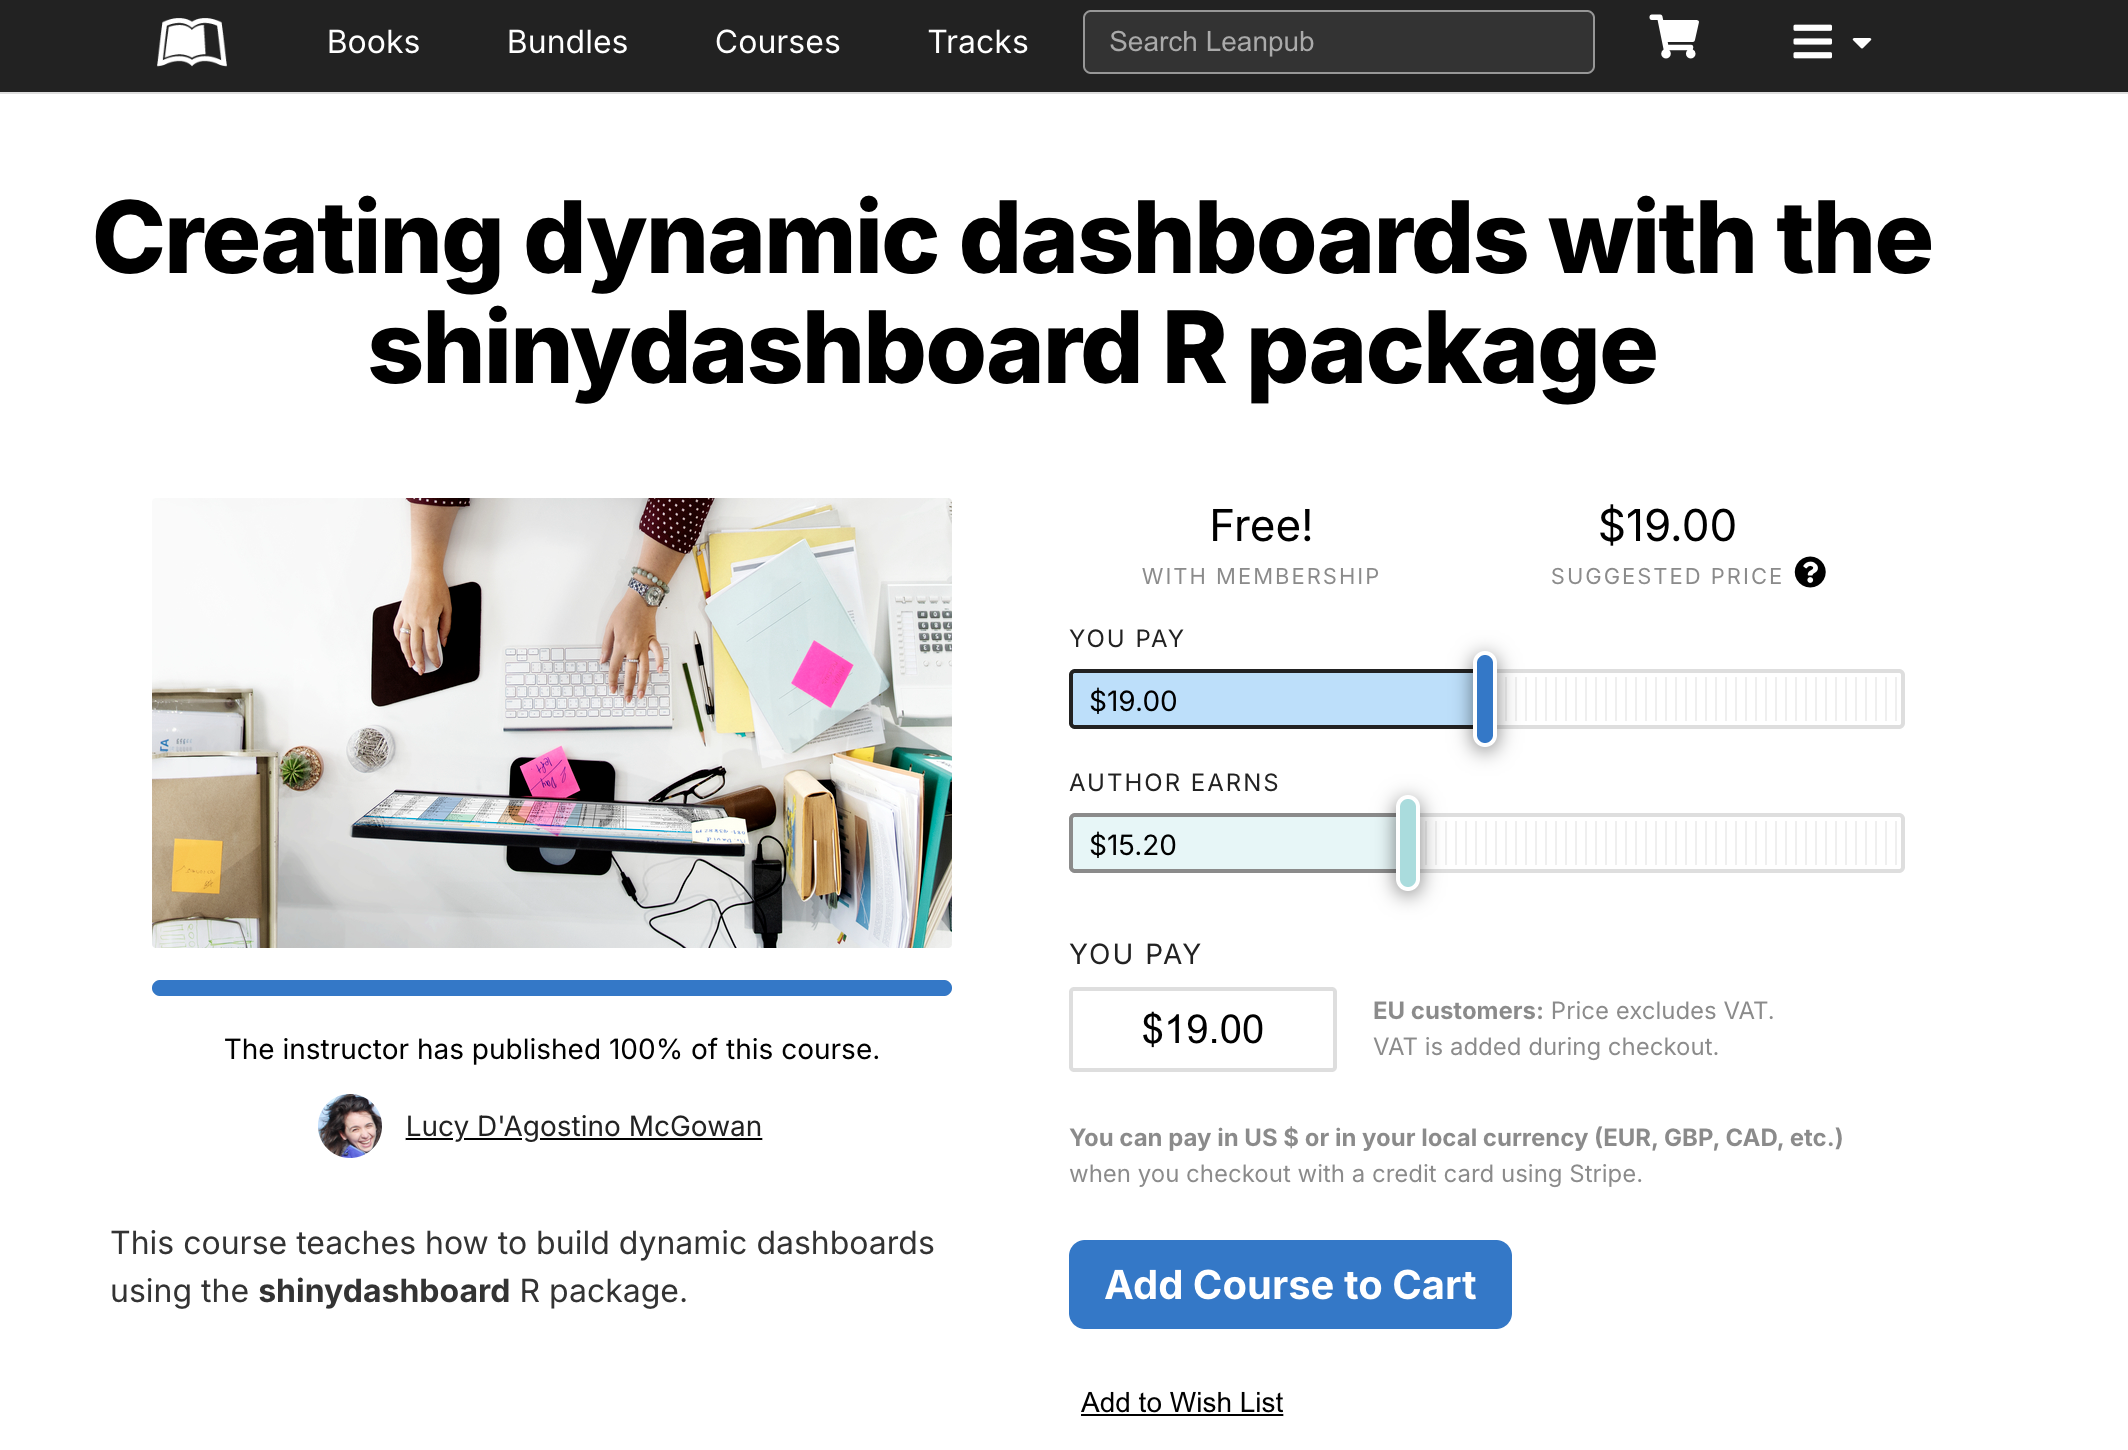
Creating dynamic dashboards with the shinydashboard R package
dashboards
shiny
Sep 14, 2020
Comparing Multiple Means in R: Repeated Measures ANOVA in R
statistics
Sep 13, 2020
Summary and Analysis of Extension Program Evaluation in R
statistics
book
Sep 13, 2020
How to prepare and teach an R lesson
teaching r
blog
Aug 15, 2020
R For SNA
statistics
Aug 11, 2020
Statistical Rethinking 2 with Stan and R
statistics
book
stan
Aug 2, 2020
Meta RMarkdown - Taxonomy and Use cases
markdown
Jul 25, 2020
How I Teach R Markdown
markdown
May 28, 2020
GIT for humans
git
book
Apr 25, 2020
rstudio4edu A Handbook for Teaching and Learning with R and RStudio
teaching r
learning R
book
Sep 11, 2019
Building a data-driven CV with R
cv
Sep 4, 2019
Advanced data visualization with R and ggplot2 a practical
visualization
Apr 19, 2019
Answering questions with data
statistics
Sep 1, 2018
Crazy graphs
visualization
not r related
Apr 22, 2018
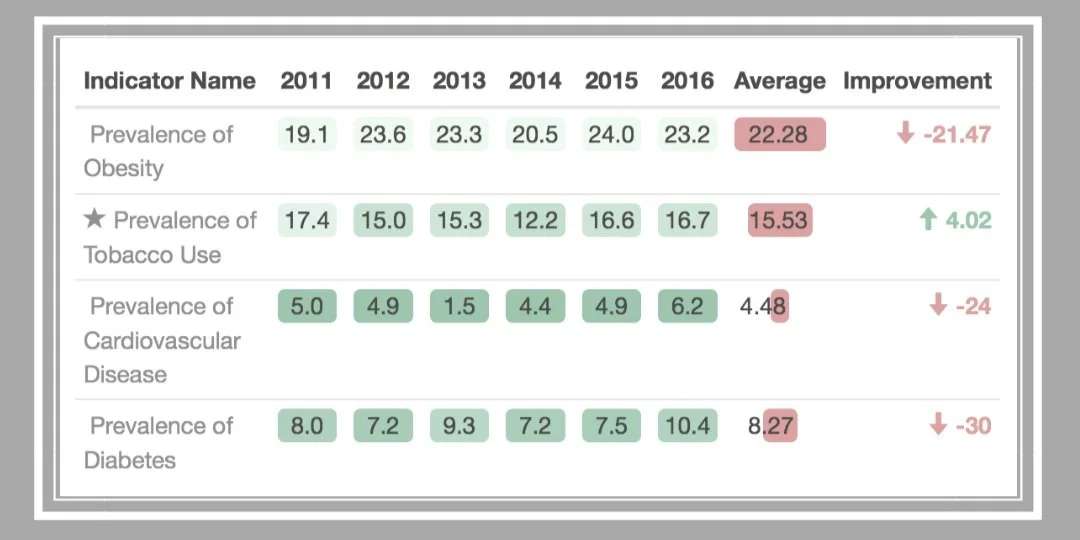
Create stylish tables in R using formattables
visualization
blog
Apr 22, 2018
No matching items
Back to top