Model Summary

Author

Dr. Joscelin Rocha-Hidalgo

Published

April 22, 2025

Buy me a coffeeBuy me a coffee


Excerpt from site: modelsummary creates beautiful and customizable tables to summarize statistical models in R. Results from several models are presented side-by-side. Tables can be echoed to the R console or viewed in the RStudio Viewer. They can be saved to HTML, PDF, Text/Markdown, LaTeX, MS Word, RTF, JPG, and PNG formats. Tables can easily be embedded in dynamic document pipelines like Rmarkdown, knitr, or Sweave.

  1. Link to site: https://vincentarelbundock.github.io/modelsummary/
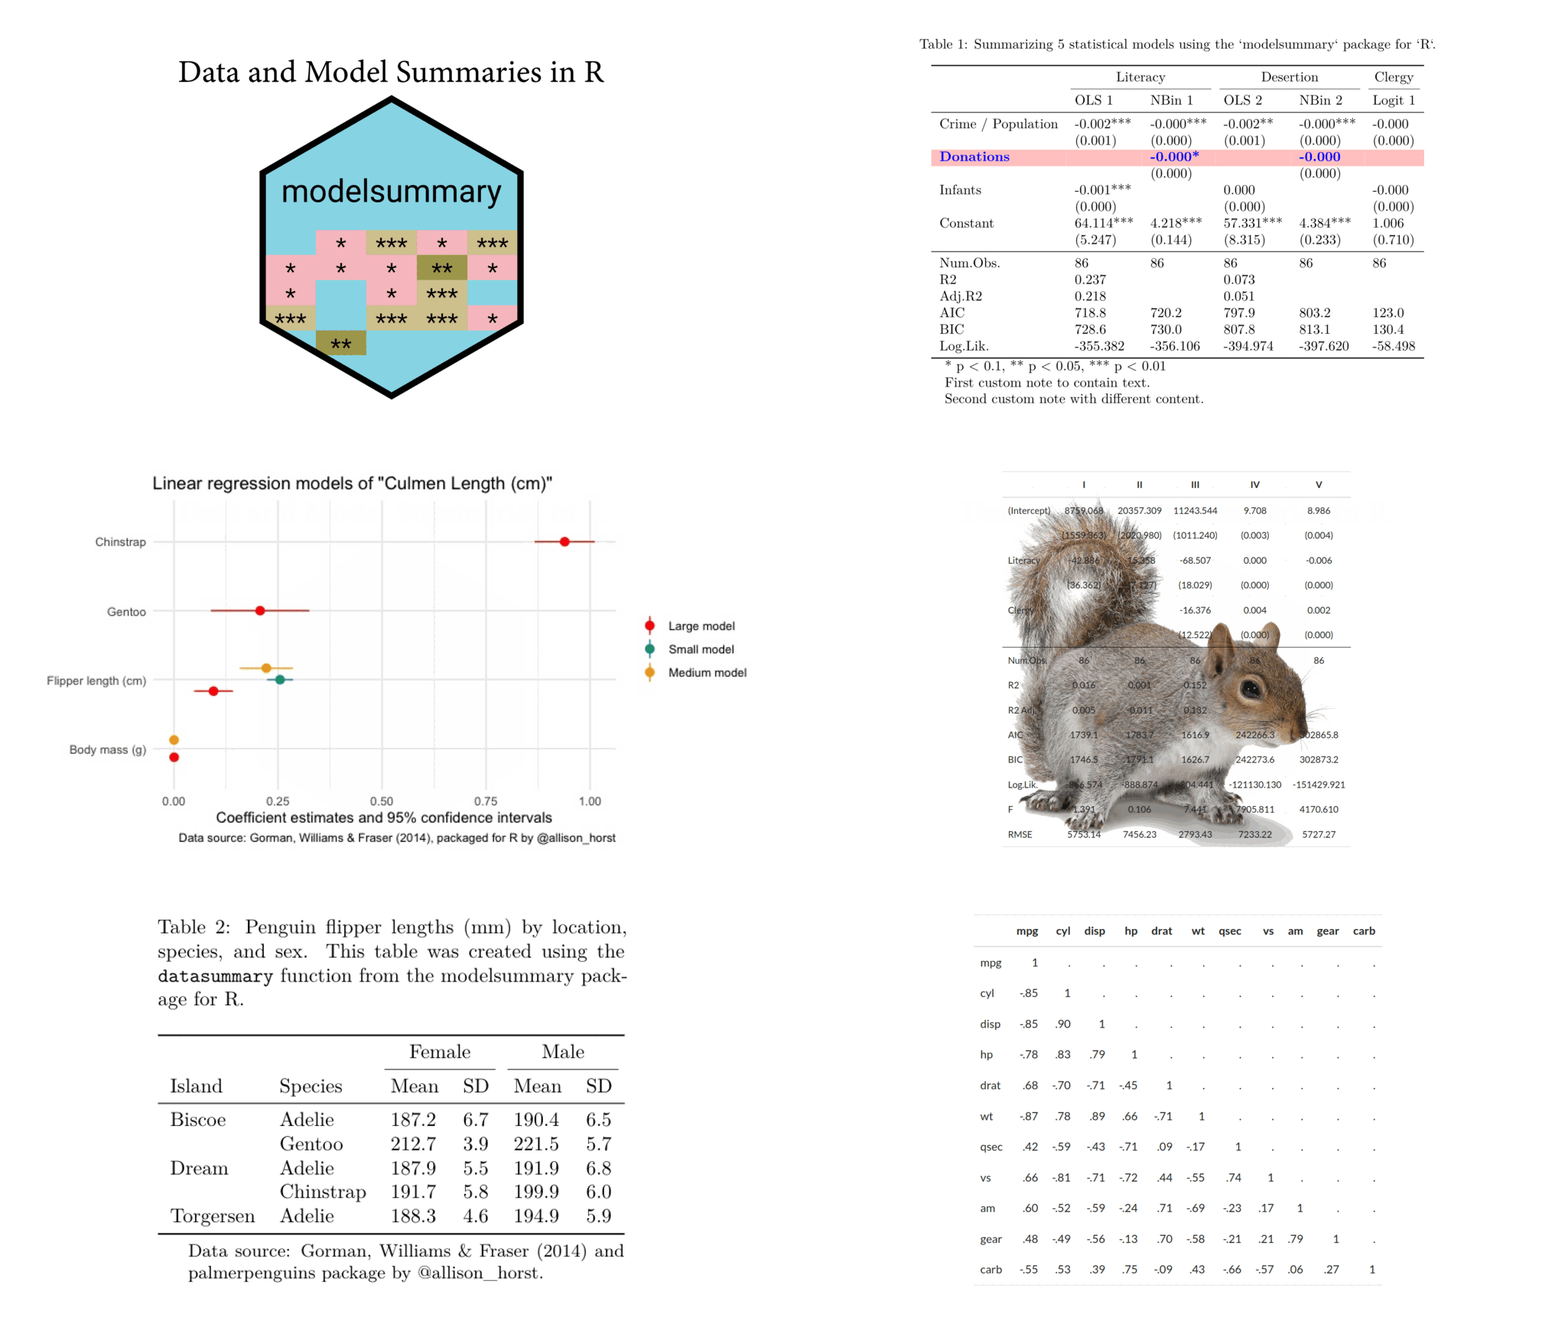
A collage of R statistical outputs and summary tables. On the left are various tables showing regression results, descriptive statistics, and a coefficient plot for penguin species. The right side features a penguin flipper length comparison by species and sex, a summary table with variable statistics including unique values, mean, SD, and distribution plots, and a small regression output for car performance metrics.

Back to top