By SAROJ
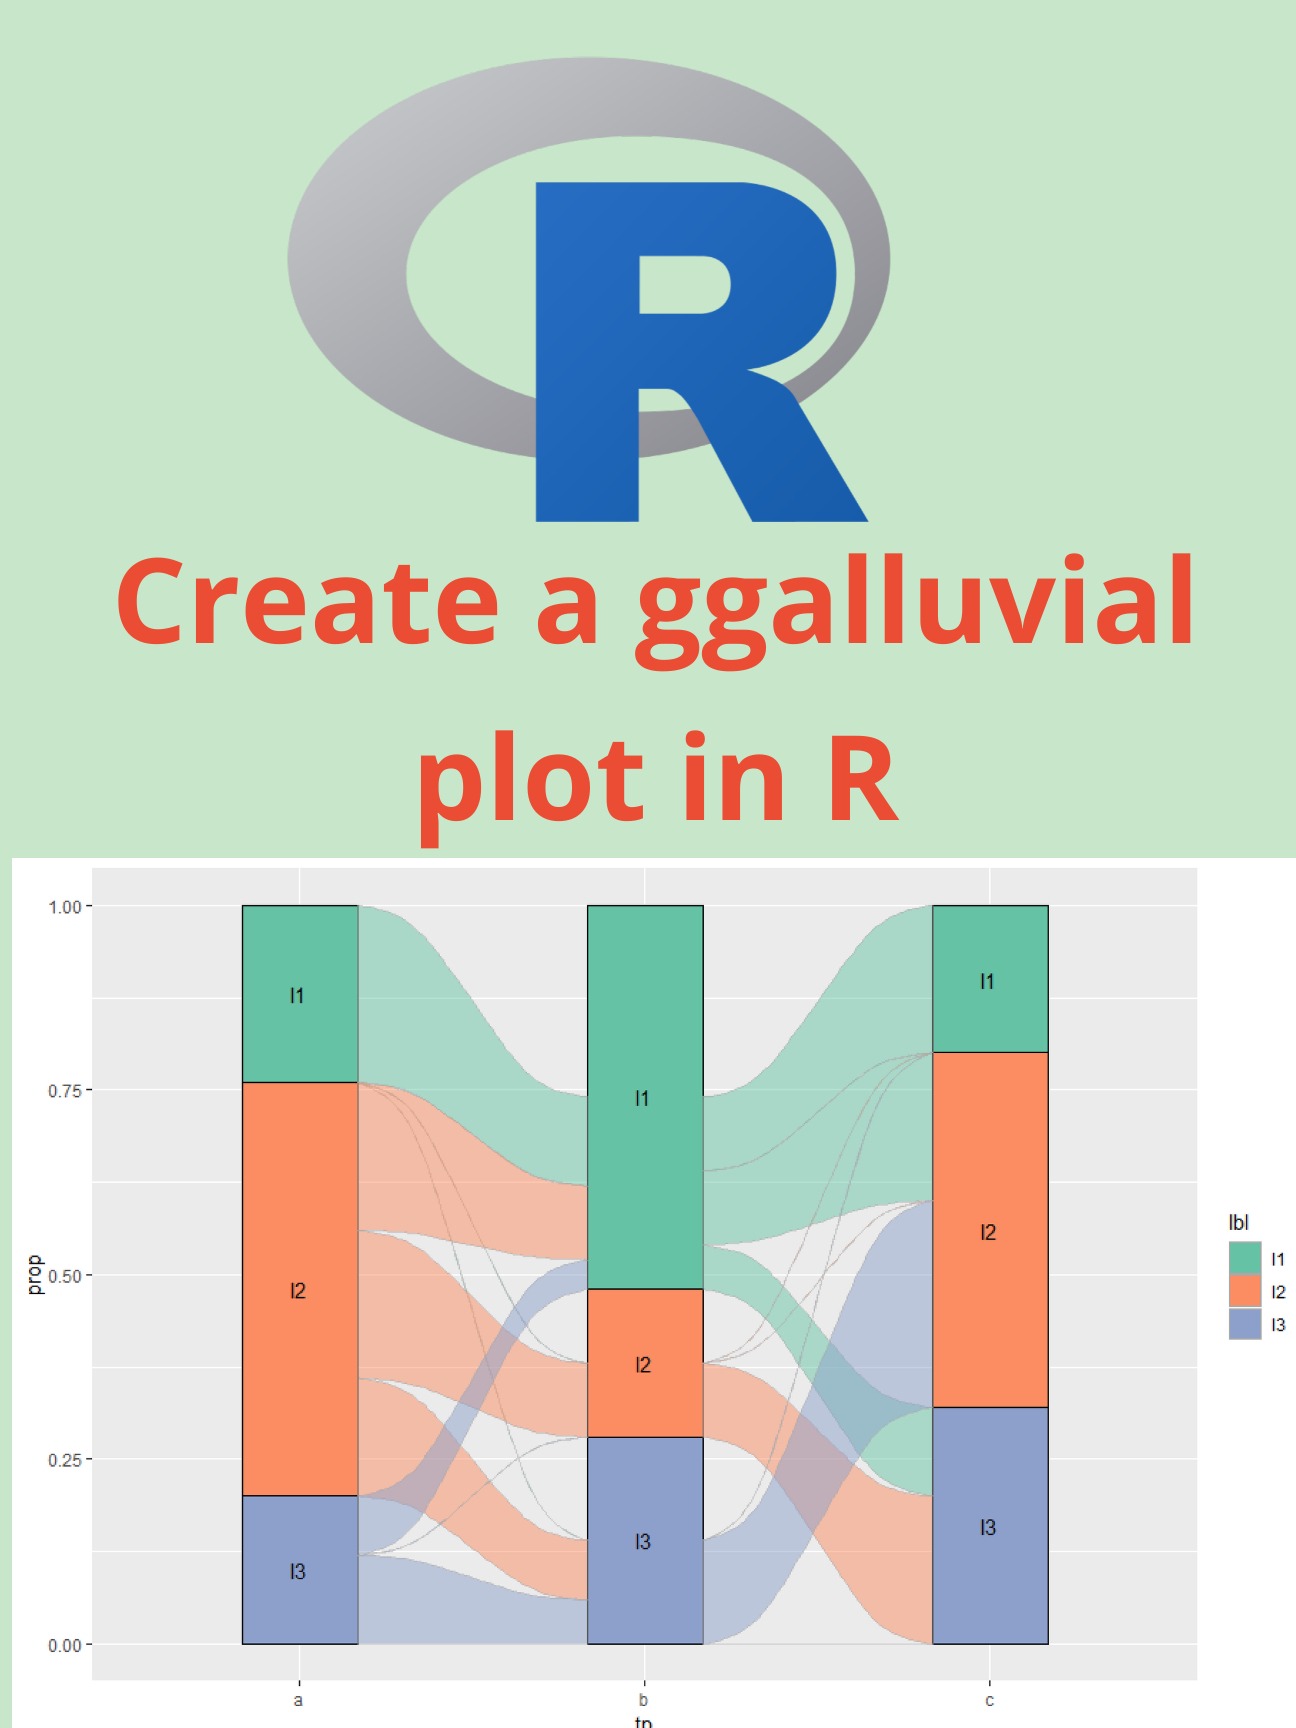
Excerpt from blog: A ggalluvial plot, also known as an alluvial diagram, is a type of visualization used to show how categorical data is distributed among different groups. It is particularly useful for visualizing how categorical variables are related to each other across different levels of a grouping variable.
- Link to blog here: https://pyoflife.com/create-a-ggalluvial-plot-in-r/