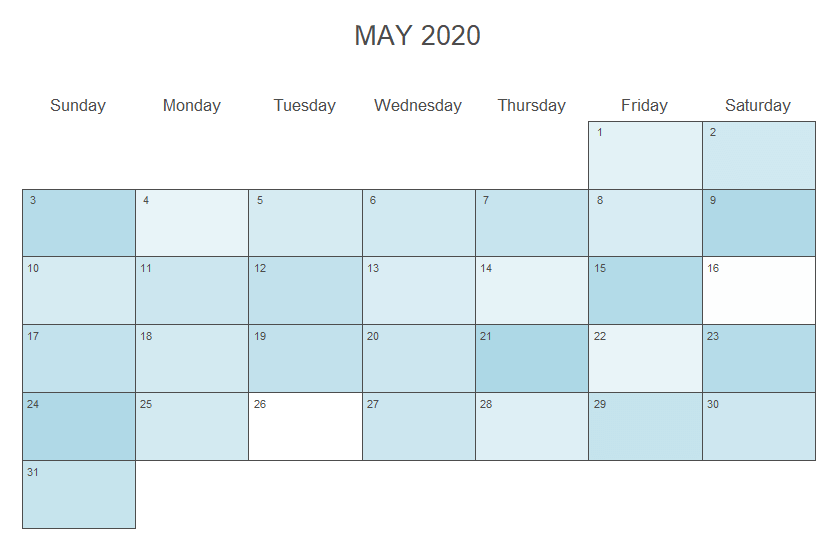
Excerpt from site: The calendR package allows creating fully customizable ggplot2 calendar plots with a single function. In addition, the package provides arguments to create heatmap calendars. In this tutorial you will learn how to create ready to print yearly and monthly calendar plots in R.
- Link to blog here: https://r-coder.com/calendar-plot-r/
- Link to package here: https://cran.r-project.org/web/packages/calendR/
