By Shannon Pileggi
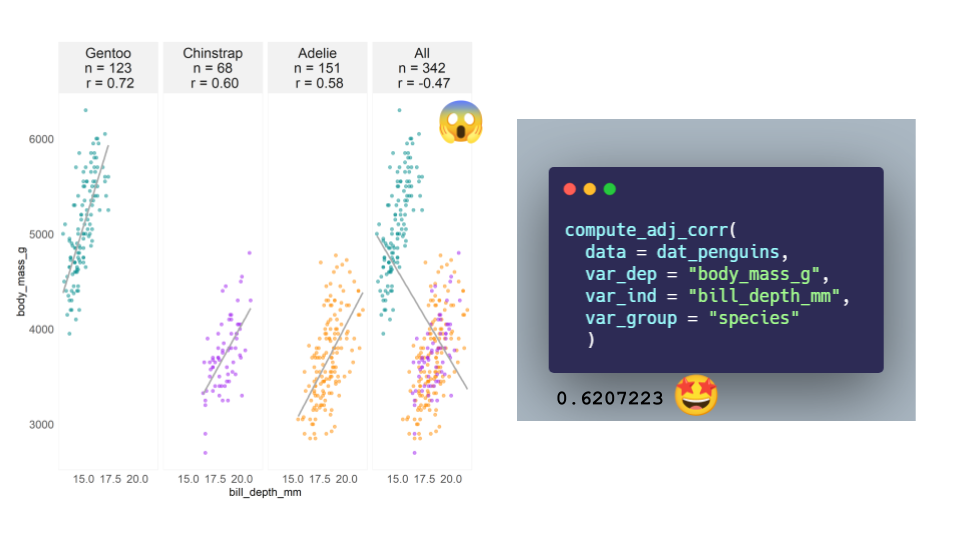
This article discusses how to obtain accurate correlation estimates in the presence of underlying groups or related observations. It demonstrates the use of linear mixed models to adjust correlation estimates, providing sensible overall correlations across subgroups. The article includes applied examples using the Palmer penguins dataset and TidyTuesday Spotify songs to illustrate the approach.
- Link to article: https://www.pipinghotdata.com/posts/2021-10-11-estimating-correlations-adjusted-for-group-membership/