Visualization of MRI data in R

Author

Dr. Joscelin Rocha-Hidalgo

Published

December 13, 2020

Buy me a coffeeBuy me a coffee


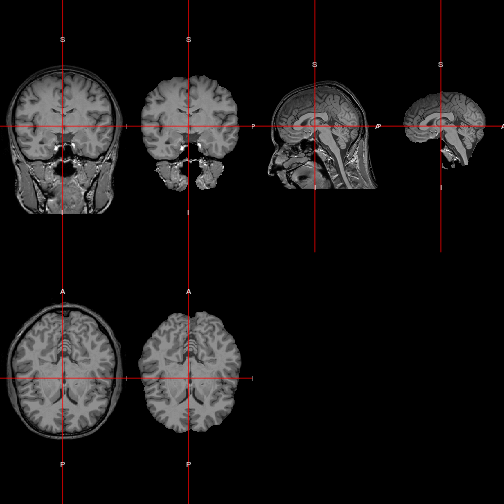
Description from site: In this blog post I present some functions which I was able to find for MRI visualization in R, and which I found to be very useful. All functions presented below presuppose an image in the NIfTI data format as input, and are very user-friendly.

Uses the oro.nifti package

  1. Link to blog here: https://www.alexejgossmann.com/MRI_viz/
  2. Same blog difference place: https://www.r-bloggers.com/2017/01/visualization-of-mri-data-in-r/

Series of brain MRI slices shown in different anatomical planes. The image displays coronal, sagittal, and axial views of the brain, each overlaid with red crosshairs marking the same anatomical coordinates across views. The scans reveal structural brain details with clear contrast between gray and white matter.

Back to top