Working with fMRI data using R

Author

Dr. Joscelin Rocha-Hidalgo

Published

December 13, 2020

Buy me a coffeeBuy me a coffee


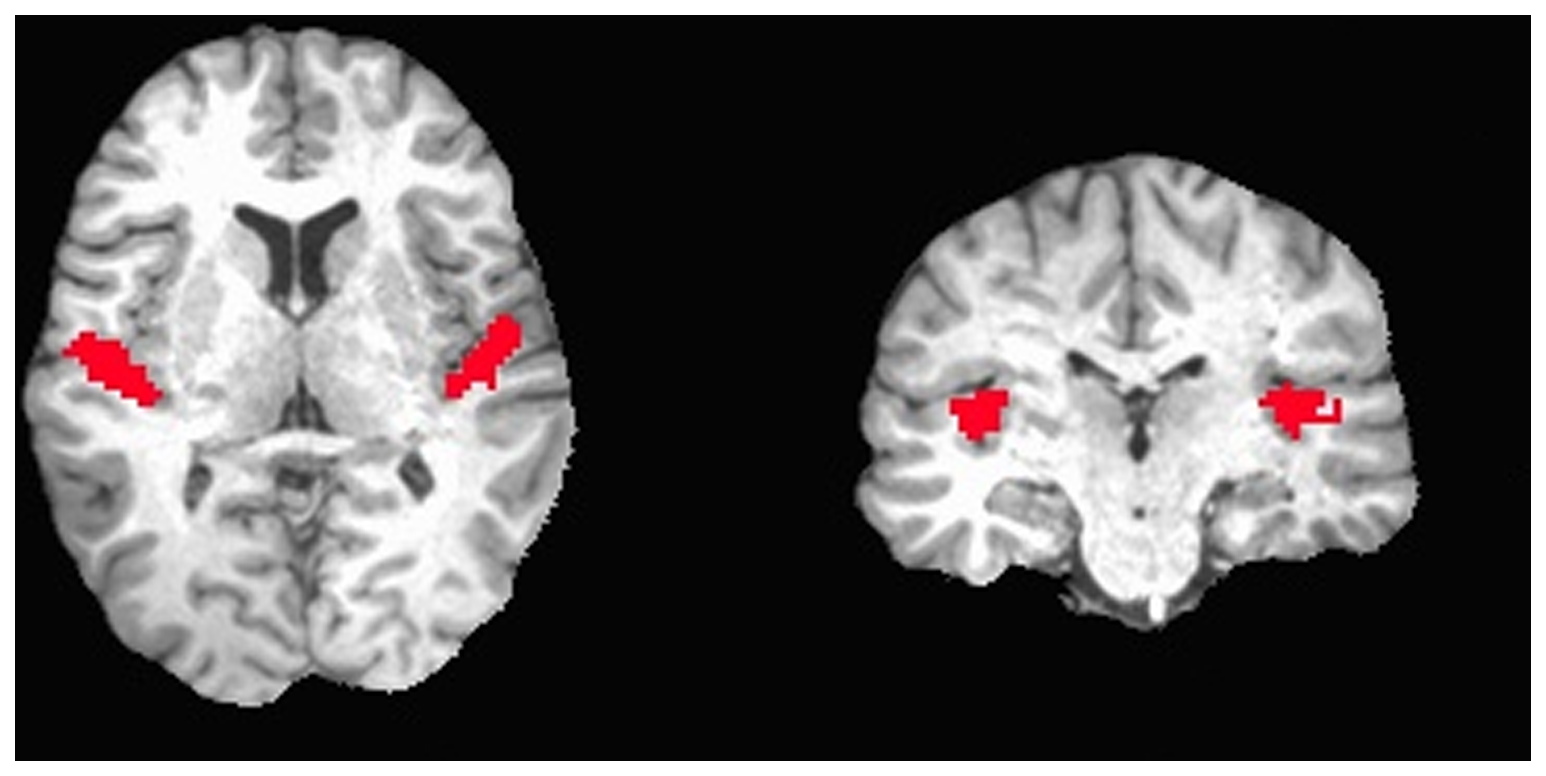
Description from site: Reading and visualising fMRI data with R/neuroconductor.

  1. Link to site: https://jokedurnez.github.io/validating-fmri/01-introduction/index.html

Two grayscale brain scan slices (axial on the left, coronal on the right) with red-highlighted regions of interest in the bilateral medial temporal lobes. These red regions likely indicate statistically significant activation or structural differences in neuroimaging data.

Back to top